

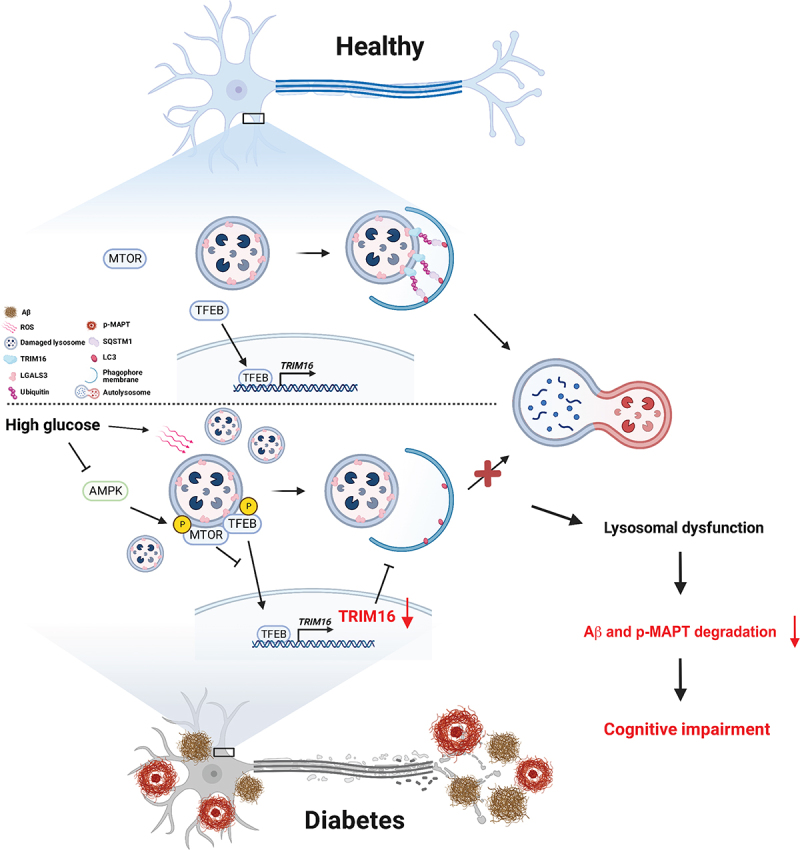
TRIM16-mediated lysophagy suppresses high-glucose-accumulated neuronal Aβ
- PMID: 37357416
- PMCID: PMC10472864
- DOI: 10.1080/15548627.2023.2229659
TRIM16-mediated lysophagy suppresses high-glucose-accumulated neuronal Aβ
Abstract
Aβ: amyloid β; AD: Alzheimer disease; AMPK: 5' adenosine monophosphate-activated protein kinase; CTSB: cathepsin B; CTSD: cathepsin D; DM: diabetes mellitus; ESCRT: endosomal sorting complex required for transport; FBXO27: F-box protein 27; iPSC-NDs: induced pluripotent stem cell-derived neuronal differentiated cells; LAMP1: lysosomal-associated membrane protein 1; LMP: lysosomal membrane permeabilization; LRSAM1: leucine rich repeat and sterile alpha motif containing 1; MAP1LC3/LC3: microtubule associated protein 1 light chain 3; MTORC1: mechanistic target of rapamycin kinase complex 1; p-MAPT/tau: phosphorylated microtubule associated protein tau; ROS: reactive oxygen species; STZ: streptozotocin; TFE3: transcription factor E3; TFEB: transcription factor EB; TRIM16: tripartite motif containing 16; UBE2QL1: ubiquitin conjugating enzyme E2 Q family like 1; VCP: valosin containing protein.
Keywords: Amyloid β; TFEB; TRIM16; autophagy; diabetes; hippocampal neuron.
Conflict of interest statement
No potential conflict of interest was reported by the authors.
Figures
References
Publication types
MeSH terms
Substances
LinkOut - more resources
Full Text Sources
Other Literature Sources
Research Materials
Miscellaneous