

Cohesin-mediated DNA loop extrusion resolves sister chromatids in G2 phase
- PMID: 37357575
- PMCID: PMC10425840
- DOI: 10.15252/embj.2023113475
Cohesin-mediated DNA loop extrusion resolves sister chromatids in G2 phase
Abstract
Genetic information is stored in linear DNA molecules, which are highly folded inside cells. DNA replication along the folded template path yields two sister chromatids that initially occupy the same nuclear region in an intertwined arrangement. Dividing cells must disentangle and condense the sister chromatids into separate bodies such that a microtubule-based spindle can move them to opposite poles. While the spindle-mediated transport of sister chromatids has been studied in detail, the chromosome-intrinsic mechanics presegregating sister chromatids have remained elusive. Here, we show that human sister chromatids resolve extensively already during interphase, in a process dependent on the loop-extruding activity of cohesin, but not that of condensins. Increasing cohesin's looping capability increases sister DNA resolution in interphase nuclei to an extent normally seen only during mitosis, despite the presence of abundant arm cohesion. That cohesin can resolve sister chromatids so extensively in the absence of mitosis-specific activities indicates that DNA loop extrusion is a generic mechanism for segregating replicated genomes, shared across different Structural Maintenance of Chromosomes (SMC) protein complexes in all kingdoms of life.
Keywords: chromosomes; cohesin; condensin; mitosis; sister chromatid resolution.
© 2023 The Authors. Published under the terms of the CC BY 4.0 license.
Conflict of interest statement
The authors declare that they have no conflict of interest.
Figures

- A
Sister chromatid labelling assay. Cells presynchronised to the G1/S boundary are cultured for one cell cycle in the presence of F‐ara‐EdU and then for another cell cycle in nucleotide‐free medium to obtain cells with one sister chromatid labelled on each replicated chromosome. Cells with two sister chromatids labelled per chromosome are generated by fixing the cells after culturing for one cell cycle in F‐ara‐EdU. For analysis, cells are arrested either in prometaphase by STLC or in G2 by RO‐3306 and DNA is stained using Hoechst 33342. F‐ara‐EdU is visualised through conjugation of AF488.
- B
Representative images from wild‐type prometaphase cells labelled on one or two sister chromatids as indicated.
- C
Representative images from wild‐type G2 cells labelled on one or two sister chromatids as indicated.
- D
Quantification of sister chromatid separation in one‐sister labelled prometaphase cells for experimental conditions as indicated. Dots represent individual cells; red bars indicate the mean. Wild‐type (n = 83 cells), ΔSMC4 (n = 75 cells) and ΔNIPBL (n = 48 cells) were analysed. Significance was tested using a two‐tailed Mann–Whitney U test; P = 2.33 × 10⁻²⁷.
- E
Quantification of sister chromatid separation as in (D) for one‐sister labelled G2 cells. Dots represent individual cells; red bars indicate the mean. Wild‐type (n = 69 cells), ΔSMC4 (n = 50 cells) and ΔNIPBL (n = 70 cells) were analysed. Significance was tested using a two‐tailed Mann–Whitney U test; P = 6.55 × 10⁻¹⁹.
- F
Representative images from ΔSMC4 prometaphase cells labelled on one sister chromatid.
- G
Representative images from ΔSMC4 G2 cells labelled on one sister chromatid.
- H
Representative images from ΔNIPBL prometaphase cells labelled on one sister chromatid.
- I
Representative images from ΔNIPBL G2 cells labelled on one sister chromatid.

- A
Schematic of experimental procedure for generation of two or one‐sister labelled chromatids in wild‐type cells. Cells were treated with the requisite compounds as indicated.
- B
Bar plot indicating the percentage of chromosome segments with 0, 1 or 2 labelled sister chromatids for wild‐type prometaphase cells, fixed during the first mitosis after labelling with F‐ara‐EdU. n = 121 sister chromatid pairs from 15 cells from seven replicates analysed. Bar indicates mean; error bars indicate standard deviation.
- C
Bar plot indicating the percentage of chromosome segments with 0, 1 or 2 labelled sister chromatids for wild‐type prometaphase cells, fixed during the second mitosis after labelling with F‐ara‐EdU. n = 129 sister chromatid pairs from 27 cells from seven replicates analysed. Bar indicates mean; error bars indicate standard deviation.
- D
Schematic indicating the image analysis pipeline to calculate the sister chromatid separation score. Extract central Z‐sections: The central slice of an input Z‐stack is calculated, and the five slices above and below are chosen (11 slices in total). Segment chromatin, extract pixel intensities: The chromatin channel is segmented to generate a mask, which is applied to the Hoechst and F‐ara‐EdU channels. Pixel intensities within the mask are extracted. Pixel correlation analysis: The Spearman correlation coefficient (SCC) between Hoechst and F‐ara‐EdU pixel values in the mask is calculated first per slice, and then per cell. See Materials and Methods for details of the normalisation procedure to generate the separation score. Plot is an example scatter plot representation of pixel value intensities for Hoechst and F‐ara‐EdU fluorescence in a prometaphase cell labelled on one sister chromatid.
- E
Scatter plot representation and SCC of pixel value intensities for Hoechst and F‐ara‐EdU fluorescence for a single slice of a wild‐type prometaphase cell, fixed during the 1st mitosis after labelling with F‐ara‐EdU (two‐sister labelled). Real data is shown.
- F
Scatter plot representation and SCC of pixel value intensities for Hoechst and F‐ara‐EdU fluorescence for a single slice of a wild‐type prometaphase cell, fixed during the 2nd mitosis after labelling with F‐ara‐EdU (one‐sister labelled). Real data is shown.
- G
Quantification of the Spearman correlation coefficient between Hoechst and F‐ara‐EdU for wild‐type prometaphase chromosomes fixed during the 1st (two‐sister labelled) or 2nd (one‐sister labelled) mitosis after labelling with F‐ara‐EdU, as indicated. Individual data points represent the mean SCC per cell, red bars indicate the mean. n = 59 cells (1st mitosis), n = 83 cells (2nd mitosis). Significance was tested using a two‐tailed Mann–Whitney U test; P = 3.91 × 10⁻²⁴.
- H
Quantification of sister chromatid separation as in Fig 1D and E, for wild‐type prometaphase chromosomes fixed during the 1st (two‐sister labelled) or 2nd (one‐sister labelled) mitosis after labelling with F‐ara‐EdU. Dots represent individual cells; red bars indicate the mean. Sample numbers and statistics as in (G). Quantification for one‐sister labelled cells is the same as in Fig 1D (wild‐type) to allow side by side comparison with two‐sister labelled prometaphase cells.
- I
Quantification of sister chromatid separation as in Fig 1D and E. Two‐sister labelled (n = 44 cells) and one‐sister sister labelled (n = 69 cells) wild‐type cells synchronised to G2 by RO‐3306 were analysed. Dots represent individual cells; red bars indicate the mean. Significance was tested using a two‐tailed Mann–Whitney U test; P = 4.06 × 10⁻¹⁹. Quantification for one‐sister labelled G2 cells is the same as in Fig 1E (wild‐type) to allow side by side comparison with two‐sister labelled G2 cells.

- A
Representative images for one‐sister labelled sister chromatids in cells stained with an anti‐phospho‐H3‐Ser10 antibody from wild‐type prometaphase, prophase and G2 cells as indicated.
- B
Quantification of mean phospho‐H3‐Ser10 fluorescence within the chromatin mask for central Z‐slices for the conditions shown in (A). Prometaphase (n = 48 cells), prophase (n = 32 cells), and G2 (n = 31 cells) cells were analysed. Dots represent individual cells; red bars indicate the mean. Significance was tested using a two‐tailed Mann–Whitney U test; P = 9.61 × 10⁻¹² (prophase), P = 8.33 × 10⁻¹⁴ (prometaphase).
- C
Representative images for one‐sister labelled sister chromatids in cells stained with an anti‐cyclin B1 antibody, from wild‐type prometaphase, prophase and G2 arrested cells as indicated.
- D
Quantification of mean cyclin B1 fluorescence within the chromatin mask for central Z‐slices for the conditions shown in (C). Calculation of mean fluorescence was performed as described in (B). Prometaphase (n = 48 cells), prophase (n = 32 cells), and G2 (n = 69 cells) cells were analysed. Dots represent individual cells; red bars indicate the mean. Significance was tested using a two‐tailed Mann–Whitney U test; P = 7.95 × 10⁻¹⁶ (prophase).
- E
Representative images for one‐sister labelled sister chromatids from G2 cells, treated with RO‐3306 or untreated, as indicated.
- F
Quantification of sister chromatid separation as in Fig 1D and E for one‐sister labelled wild‐type G2 cells, for the conditions shown in (E). RO‐3306 treated (n = 69 cells) and untreated (n = 16 cells) cells were analysed. Dots represent individual cells; red bars indicate the mean. Quantification for RO‐3306 treated cells is the same as in Fig 1E (wild‐type) to allow side by side comparison with untreated cells. A different example RO‐3306 treated cell is shown.

- A
Schematic of experimental procedure for generation of one‐sister labelled chromatids in ΔSMC4 G2 cells. Cells were treated with the requisite compounds as indicated; the end point indicates the time of fixation. Prometaphase samples were generated by washing out RO‐3306 and releasing into medium containing STLC.
- B
Immunoblot analysis of SMC4 in wild‐type (WT) cells, untreated SMC4‐AID cells and SMC4‐AID cells treated for either 1 or 3 h with 5‐Ph‐IAA. Representative example of n = 3 biological replicates.
- C
Immunofluorescence analysis of HeLa cells homozygously tagged for SMC4‐mAID‐Halo and stably expressing OsTIR1F74G. Cells were incubated for 3 h with (ΔSMC4) or without (Control) 1 μM 5‐Ph‐IAA before subsequently staining of SMC4 with HaloTag TMR Ligand. DNA was stained with Hoechst 33342.
- D
Quantification of mean nuclear SMC4 fluorescence per cell, as shown in (C). Dots represent individual cells; red bars indicate the mean. Wild‐type cells were stained with HaloTag TMR Ligand and the mean Halo‐TMR fluorescence within the segmented nuclei then calculated. Normalisation was performed relative to the mean nuclear Halo‐TMR fluorescence of wild‐type cells (0 value) and control SMC4‐AID cells (1 value). For each condition two experimental replicates were performed. n = 1,159 cells analysed for control SMC4‐AID cells, n = 1,000 cells analysed for ΔSMC4 cells. Significance was tested using a two‐tailed Mann–Whitney U test; P < 10−324 (precision limit of floating‐point arithmetic).
- E
Representative images from ΔSMC4 prometaphase cells labelled on one or two sister chromatids as indicated.
- F
Representative images from ΔSMC4 G2 cells labelled on one or two sister chromatids as indicated.
- G
Quantification of sister chromatid separation as in Fig 1D and E, for ΔSMC4 prometaphase cells labelled on one or two sister chromatids. Dots represent individual cells; red bars indicate the mean. Two‐sister labelled (n = 26 cells) and one‐sister labelled (n = 75 cells) cells were analysed. Quantification for one‐sister labelled ΔSMC4 prometaphase cells is the same as in Fig 1D (ΔSMC4) to allow side by side comparison with two‐sister labelled cells. A different example prometaphase cell labelled on one sister chromatid is shown.
- H
Quantification of sister chromatid separation as in Fig 1D and E, for ΔSMC4 G2 cells labelled on one or two sister chromatids. Dots represent individual cells; red bars indicate the mean. Two‐sister labelled (n = 19 cells) and one‐sister labelled (n = 50 cells) cells were analysed. Quantification for one‐sister labelled ΔSMC4 G2 cells is the same as in Fig 1E (ΔSMC4) to allow side by side comparison with two‐sister labelled cells. A different example G2 cell labelled on one sister chromatid is shown.

- A
Schematic of experimental procedure for generation of one‐sister labelled chromatids in ΔNIPBL G2 cells. Cells were treated with the requisite compounds as indicated; the end point indicates the time of fixation. Prometaphase samples were generated by washing out RO‐3306 and releasing into medium containing STLC.
- B
Immunoblot analysis of NIPBL in wild‐type (WT) cells, untreated NIPBL‐AID cells and NIPBL‐AID cells treated for either 1 or 3 h with 5‐Ph‐IAA. Representative example of n = 2 biological replicates.
- C
Immunofluorescence analysis of HeLa cells homozygously tagged for mEGFP‐mAID‐NIPBL and stably expressing OsTIR1F74G. Cells were incubated for 2 h with (ΔNIPBL) or without (Control) 1 μM 5‐Ph‐IAA before subsequently fixing and staining for mEGFP with an anti‐GFP nanobody. DNA was stained with Hoechst 33342.
- D
Quantification of mean nuclear mEGFP‐mAID‐NIPBL fluorescence per cell, as shown in (C). Dots represent individual cells; red bars indicate the mean. For each condition three experimental replicates were performed. n = 1,205 cells analysed for control NIPBL‐AID cells, n = 1,223 cells analysed for ΔNIPBL cells. Significance was tested using a two‐tailed Mann–Whitney U test; P < 10−324 (precision limit of floating‐point arithmetic).
- E
Representative images from ΔNIPBL prometaphase cells labelled on one or two sister chromatids as indicated.
- F
Representative images from ΔNIPBL G2 cells labelled on one or two sister chromatids as indicated.
- G
Quantification of sister chromatid separation as in Fig 1D and E, for ΔNIPBL prometaphase cells labelled on one or two sister chromatids. Dots represent individual cells; red bars indicate the mean. Two‐sister labelled (n = 24 cells) and one‐sister labelled (n = 48 cells) cells were analysed. Quantification for one‐sister labelled ΔNIPBL prometaphase cells is the same as in Fig 1D (ΔNIPBL) to allow side‐by‐side comparison with two‐sister labelled cells. A different example prometaphase cell labelled on one sister chromatid is shown.
- H
Quantification of sister chromatid separation as in Fig 1D and E, for ΔNIPBL G2 cells labelled on one or two sister chromatids. Dots represent individual cells; red bars indicate the mean. Two‐sister labelled (n = 54 cells) and one‐sister labelled (n = 70 cells) cells were analysed. Quantification for one‐sister labelled ΔNIPBL G2 cells is the same as in Fig 1E (ΔNIPBL) to allow side by side comparison with two‐sister labelled cells. A different example G2 cell labelled on one sister chromatid is shown.

- A–G
One sister chromatid was labelled per chromosome as in Fig 1 and SMC4 (wild‐type late prophase cells) or SCC1 (WAPL‐dTAG cells) was visualised by immunofluorescence.
- A
Representative images of control WAPL‐dTAG cells synchronised to G2 by RO‐3306.
- B
Representative images of ΔWAPL cells synchronised to G2 by RO‐3306.
- C
Representative images of ΔSororin cells synchronised to G2 by RO‐3306.
- D
Quantification of sister chromatid separation as in Fig 1D and E. Control WAPL‐dTAG G2 (n = 36 cells), ΔWAPL G2 (n = 53 cells) and ΔSororin G2 (n = 45 cells) cells were analysed. Dots represent individual cells; red bars indicate the mean. Significance was tested using a two‐tailed Mann–Whitney U test; P = 3.89 × 10⁻¹¹ (Control G2, ΔWAPL G2), P = 5.90 × 10⁻⁷ (Control G2, ΔSororin G2), P = 2.75 × 10⁻³ (ΔWAPL G2, ΔSororin G2).
- E
Representative images of ΔWAPL ΔSororin cells synchronised to G2 by RO‐3306.
- F
Representative images of wild‐type cells synchronised to late prophase by release from a RO‐3306‐mediated G2 arrest.
- G
Quantification of sister chromatid separation as in Fig 1D and E. ΔWAPL ΔSororin G2 cells (n = 51 cells) and wild‐type late prophase (n = 55 cells) cells were analysed. Dots represent individual cells; red bars indicate the mean.
- A
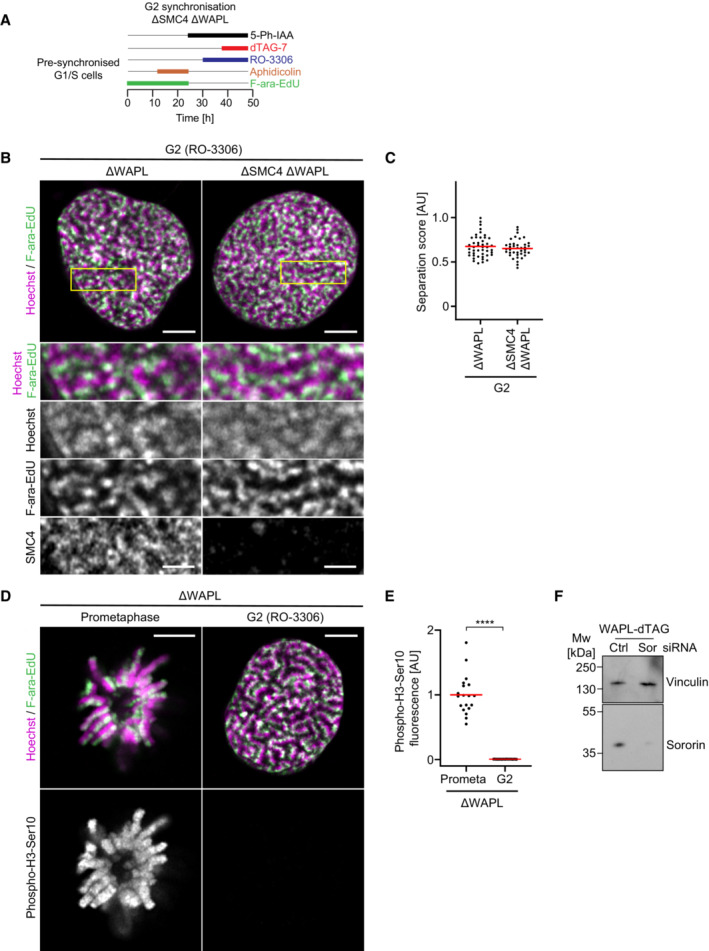
Schematic of experimental procedure for generation of one‐sister labelled chromatids in ΔSMC4 ΔWAPL G2 cells. Cells were treated with the requisite compounds as indicated; the end point indicates the time of fixation.
- B
Representative images of one‐sister labelled sister chromatids from ΔWAPL or ΔSMC4 ΔWAPL G2 cells, as indicated. Cells were labelled and fixed as in Fig 2B. SMC4 was depleted in G1 through the addition of 5‐Ph‐IAA 1 h before the final release into S phase such that cells progressed through S and G2 phase in the absence of condensins. WAPL was depleted in G2 phase after completion of DNA replication to avoid potential effects of WAPL depletion on cohesion establishment. SMC4 was visualised by staining with HaloTag TMR Ligand. Wild‐type cells were stained with HaloTag TMR Ligand to determine the fluorescence background for background subtraction. The SMC4 channel is displayed after background subtraction.
- C
Quantification of sister chromatid separation as in Fig 1D and E. ΔWAPL G2 (n = 45 cells) and ΔSMC4 ΔWAPL G2 cells (n = 39 cells) cells were analysed. Dots represent individual cells; red bars indicate the mean.
- D
Validation of cell cycle stage in ΔWAPL cells by phospho‐H3‐Ser10 immunofluorescence in cells arrested in prometaphase (prometa) by STLC and cells arrested in G2 by RO‐3306.
- E
Quantification of mean phospho‐H3‐Ser10 fluorescence for central Z‐stack slices for the conditions shown in (D). Dots represent individual cells; red bars indicate the mean. ΔWAPL prometaphase (n = 19 cells) and ΔWAPL G2 (n = 33 cells) cells were analysed. Significance was tested using a two‐tailed Mann–Whitney U test; P = 2.72 × 10⁻⁹.
- F
Immunoblot analysis of Sororin in WAPL‐dTAG cells treated with either Control (Ctrl) or Sororin (Sor) siRNAs as indicated, as in Fig 2E. Cells were harvested 40 h after transfection. Representative example of n = 2 biological replicates.

- A–C
Analysis of sister DNA and SMC protein complex distribution in cross sections perpendicular to the long chromosome axis, as shown in Fig 2B, E and F. Density of Hoechst minus F‐ara‐EdU was calculated by subtracting F‐ara‐EdU fluorescence from Hoechst fluorescence. Line profiles indicate the mean curves of individual line profile measurements aligned to the midpoint between two SMC4 peaks (wild‐type late prophase), the SCC1 peak (ΔWAPL G2 cells), or the midpoint between two SCC1 peaks (ΔWAPL ΔSororin G2 cells). (A), Lines from wild‐type late prophase (n = 157 lines from 31 cells). (B) ΔWAPL G2 cells (n = 110 lines from 18 cells). (C) ΔWAPL ΔSororin G2 cells (n = 138 lines from 18 cells) were analysed.
- D
Measurement of the sister DNA peak‐to‐peak distance for line profiles as in (A–C). Dots represent individual distance measurements between chromatids; red bars indicate the mean.
- E
Measurement of the position of the F‐ara‐EdU labelled sister chromatid relative to the closest SMC peak for line profiles as in (A–C). A positive value indicates an outward displacement relative to the axis, a negative value an inward displacement. Dots represent single line profile measurements; red bars indicate the mean. Significance was tested using a two‐tailed Mann–Whitney U test; P = 5.64 × 10−40 (late prophase); P = 3.52 × 10⁻³⁴ (ΔWAPL ΔSororin G2).

- A
Representative images of one‐sister labelled sister chromatids from ΔWAPL, ΔSMC4 ΔWAPL, or ΔSMC4 ΔWAPL ΔSororin prometaphase cells, as indicated. A schematic of the synchronisation scheme used to generate ΔSMC4 ΔWAPL prometaphase cells can be found in Appendix Fig S3A. SMC4 was depleted in G1 through the addition of 5‐Ph‐IAA 1 h before the final release into S phase such that cells progressed through S and G2 phase in the absence of condensins. WAPL was depleted in G2 phase after completion of DNA replication to avoid potential effects of WAPL depletion on cohesion establishment.
- B
Quantification of sister chromatid separation as in Fig 1D and E. ΔWAPL (n = 21 cells), ΔWAPL ΔSMC4 (n = 25 cells), and ΔWAPL ΔSMC4 ΔSororin (n = 28 cells) prometaphase cells were analysed. Dots represent individual cells; red bars indicate the mean. Significance was tested using a two‐tailed Mann–Whitney U test; P = 6.57 × 10⁻⁸ (ΔWAPL); P = 3.64 × 10⁻⁷ (ΔWAPL ΔSMC4 ΔSororin).
- C
Representative images of control prometaphase cells labelled on one sister chromatid and depleted of SMC4 for different amounts of time as indicated. A schematic of the synchronisation scheme used can be found in Appendix Fig S3B. SMC4 was visualised by immunofluorescence using an anti‐SMC4 antibody. Cells were synchronised to G2 phase by RO‐3306, before being arrested in prometaphase by STLC for 60 min. SMC4 was then depleted through the addition of 1 μM 5‐Ph‐IAA for 120 or 240 min, as indicated.
- D
Quantification of mean SMC4 fluorescence within the chromatin mask for central Z‐slices for the conditions shown in (C). Control prometaphase cells depleted of SMC4 for 0 min (Control, n = 16 cells), 120 min (n = 15 cells), or 240 min (n = 20 cells) were analysed. Dots represent individual cells; red bars indicate the mean. Significance was tested using a two‐tailed Mann–Whitney U test; P = 2.32 × 10⁻⁶ (ΔSMC4 120 min); P = 3.82 × 10⁻⁷ (ΔSMC4 240 min).
- E
Quantification of sister chromatid separation as in Fig 1D and E. Control prometaphase cells depleted of SMC4 for 0 min (Control), 120 min, or 240 min were analysed. Sample numbers as in (D). Dots represent individual cells; red bars indicate the mean. Significance was tested using a two‐tailed Mann–Whitney U test; P = 1.50 × 10⁻⁵ (ΔSMC4 120 min); P = 6.28 × 10⁻⁷ (ΔSMC4 240 min).

- A
Analysis of sister chromatid resolution by sister‐chromatid‐sensitive Hi‐C. Average contact probability curves over a range of genomic distances were calculated separately for cis and trans sister contacts (Fig EV6) to derive cis/trans sister contact ratio curves for wild‐type (black) and ΔNIPBL (red) cells synchronised to G2. The genomic resolution intervals (dashed lines) were calculated by determining the genomic distance at which cis and trans sister contacts were equally abundant (at a threshold slightly above noise).
- B
Genomic resolution analysis for prometaphase cells. Wild‐type, ΔNIPBL, and ΔSMC4 cells were analysed. Points indicate the values calculated for each replicate; bars indicate the mean.
- C
Genomic resolution analysis for G2 cells. Wild‐type, ΔNIPBL, ΔSMC4, ΔWAPL, ΔSororin, and ΔWAPL ΔSororin cells were analysed. The wild‐type and ΔSororin datasets were previously published in (Mitter et al 2020). Points indicate the values calculated for each replicate, bars indicate the mean and error bars indicate the standard deviation. Significance was tested using a two‐tailed Mann–Whitney U test; P = 1.24 × 10⁻⁴ (ΔNIPBL G2); P = 1.62 × 10⁻⁴ (ΔWAPL G2); P = 5.49 × 10⁻³ (ΔSororin G2), P = 1.47 × 10⁻³ (ΔWAPL ΔSororin G2).
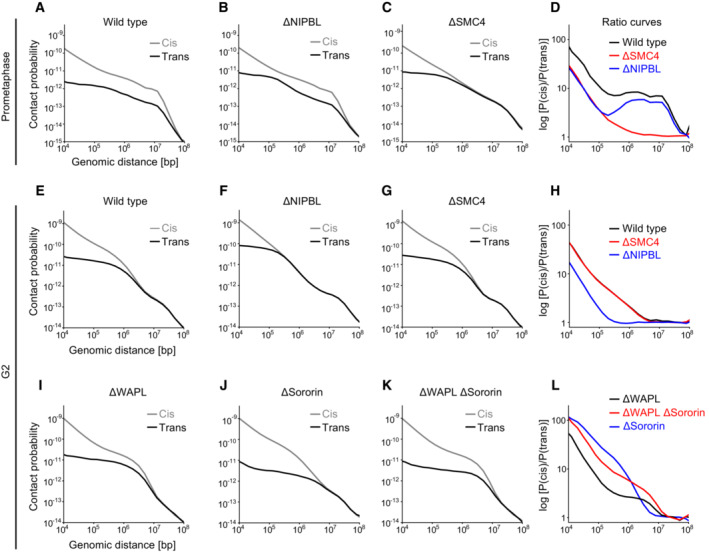
- A–L
Sister‐chromatid‐sensitive Hi‐C experiments were analysed by calculating the average contact probability for cis sister and trans sister contacts over variable genomic intervals. Merged curves of the individual replicates are shown for all panels. (A) Cis sister and trans sister contact probability curves for wild‐type prometaphase cells. (B) Cis sister and trans sister contact probability curves for ΔNIPBL prometaphase cells. (C) Cis sister and trans sister contact probability curves for ΔSMC4 prometaphase cells. (D) Ratio curves plotting cis sister contact probability / trans sister contact probability against genomic distance for the conditions in (A–C). (E) Cis sister and trans sister contact probability curves for wild‐type G2 cells. (F) Cis sister and trans sister contact probability curves for ΔNIPBL G2 cells. (G) Cis sister and trans sister contact probability curves for ΔSMC4 G2 cells. (H) Ratio curves plotting cis sister contact probability/trans sister contact probability against genomic distance for the conditions in (E–G). (I) Cis sister and trans sister contact probability curves for ΔWAPL G2 cells. (J) Cis sister and trans sister contact probability curves for ΔSororin G2 cells. (K) Cis sister and trans sister contact probability curves for ΔWAPL ΔSororin G2 cells. (L) Ratio curves plotting cis sister contact probability / trans contact probability against genomic distance for the conditions in (I–K). Biological replicates: Wild‐type prometaphase (n = 2), ΔNIPBL prometaphase (n = 3), ΔSMC4 prometaphase (n = 2), wild‐type G2 (n = 11), ΔNIPBL G2 (n = 10), ΔSMC4 G2 (n = 4), ΔWAPL G2 (n = 6), ΔSororin G2 (n = 3), ΔWAPL ΔSororin G2 (n = 4).

- A
Cohesin associated with NIPBL extrudes DNA loops to move sister chromatids apart, whereas cohesin associated with Sororin maintains linkages between sister chromatids.
- B
Hyperactivating cohesin's loop extrusion processivity resolves sister chromatids in G2 despite the presence of arm cohesion, resulting in an asymmetrical distribution of adjacent DNA loops relative to a central cohesin axis. Additional removal of cohesion along chromosome arms promotes cohesin axis separation, resulting in a symmetrical organisation of DNA loops around two separate cohesin axes. Magenta and green indicate sister DNAs, grey and black rings indicate cohesive and loop‐extruding cohesin, respectively.
References
-
- Batty P, Gerlich DW (2019) Mitotic chromosome mechanics: how cells segregate their genome. Trends Cell Biol 29: 717–726 - PubMed
-
- Beckwith KS, Ødegård‐Fougner Ø, Morero NR, Barton C, Schueder F, Tang W, Alexander S, Peters JM, Jungmann R, Birney E et al (2022) Visualization of loop extrusion by DNA nanoscale tracing in single human cells. bioRxiv 10.1101/2021.04.12.439407 [PREPRINT] - DOI
-
- Cockram C, Thierry A, Gorlas A, Lestini R, Koszul R (2021) Euryarchaeal genomes are folded into SMC‐dependent loops and domains, but lack transcription‐mediated compartmentalization. Mol Cell 81: 459–472.e10 - PubMed
Publication types
MeSH terms
Substances
Grants and funding
LinkOut - more resources
Full Text Sources
Molecular Biology Databases
Research Materials
