. 2023 Dec;91(12):1889-1902.
doi: 10.1002/prot.26542. Epub 2023 Jun 26.

Combining pairwise structural similarity and deep learning interface contact prediction to estimate protein complex model accuracy in CASP15

Affiliations

Combining pairwise structural similarity and deep learning interface contact prediction to estimate protein complex model accuracy in CASP15

Raj S Roy et al. Proteins. 2023 Dec.

Abstract

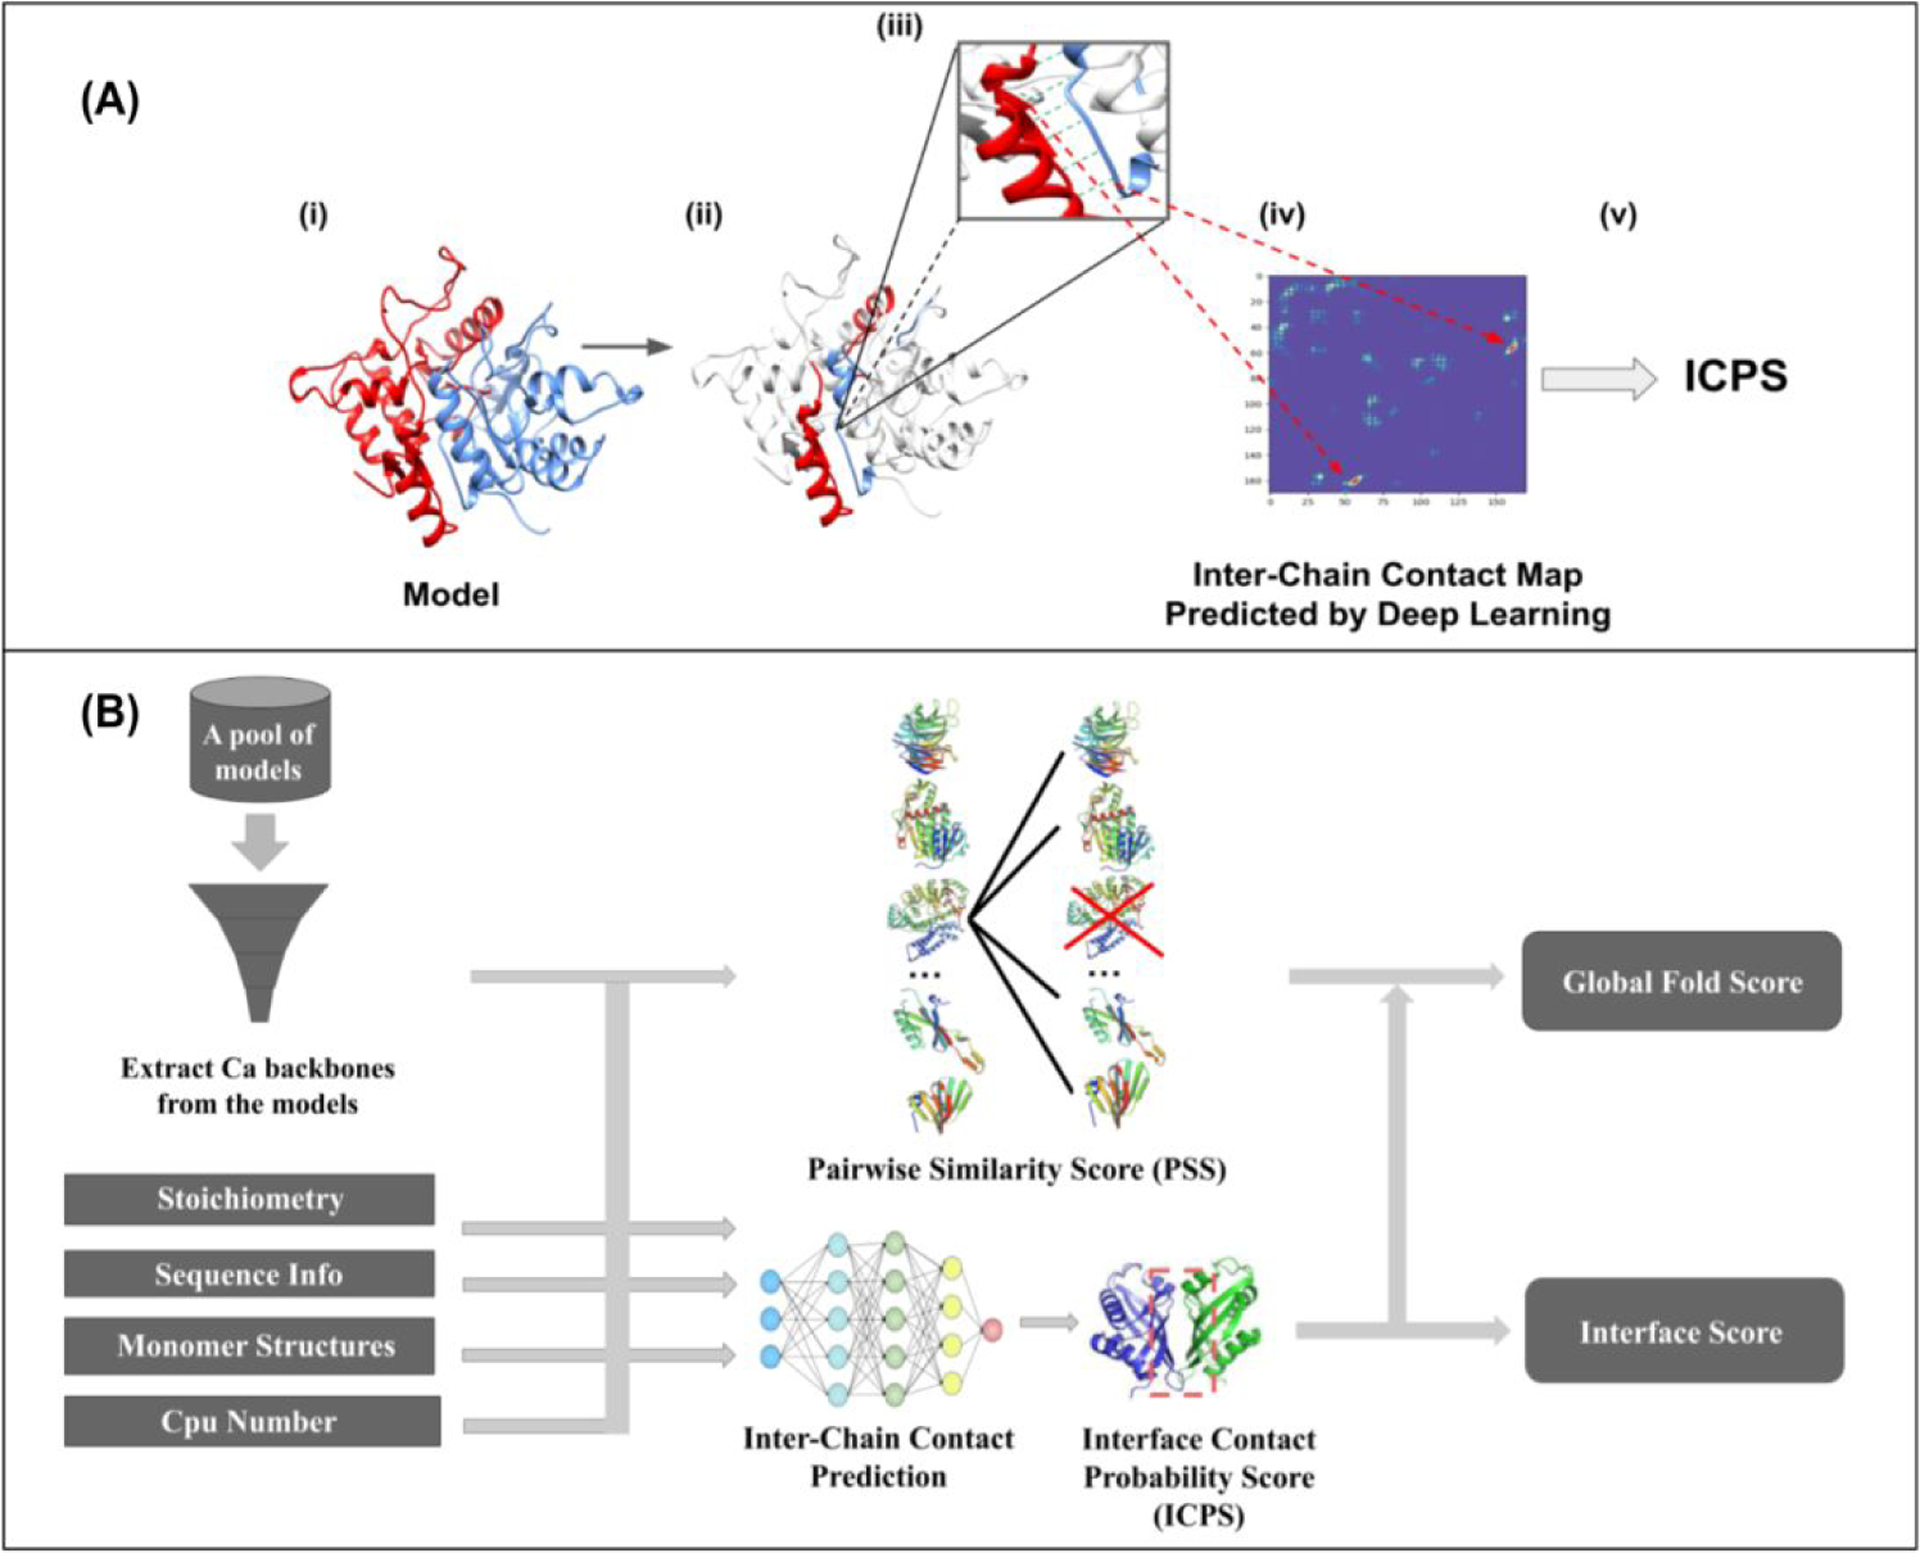
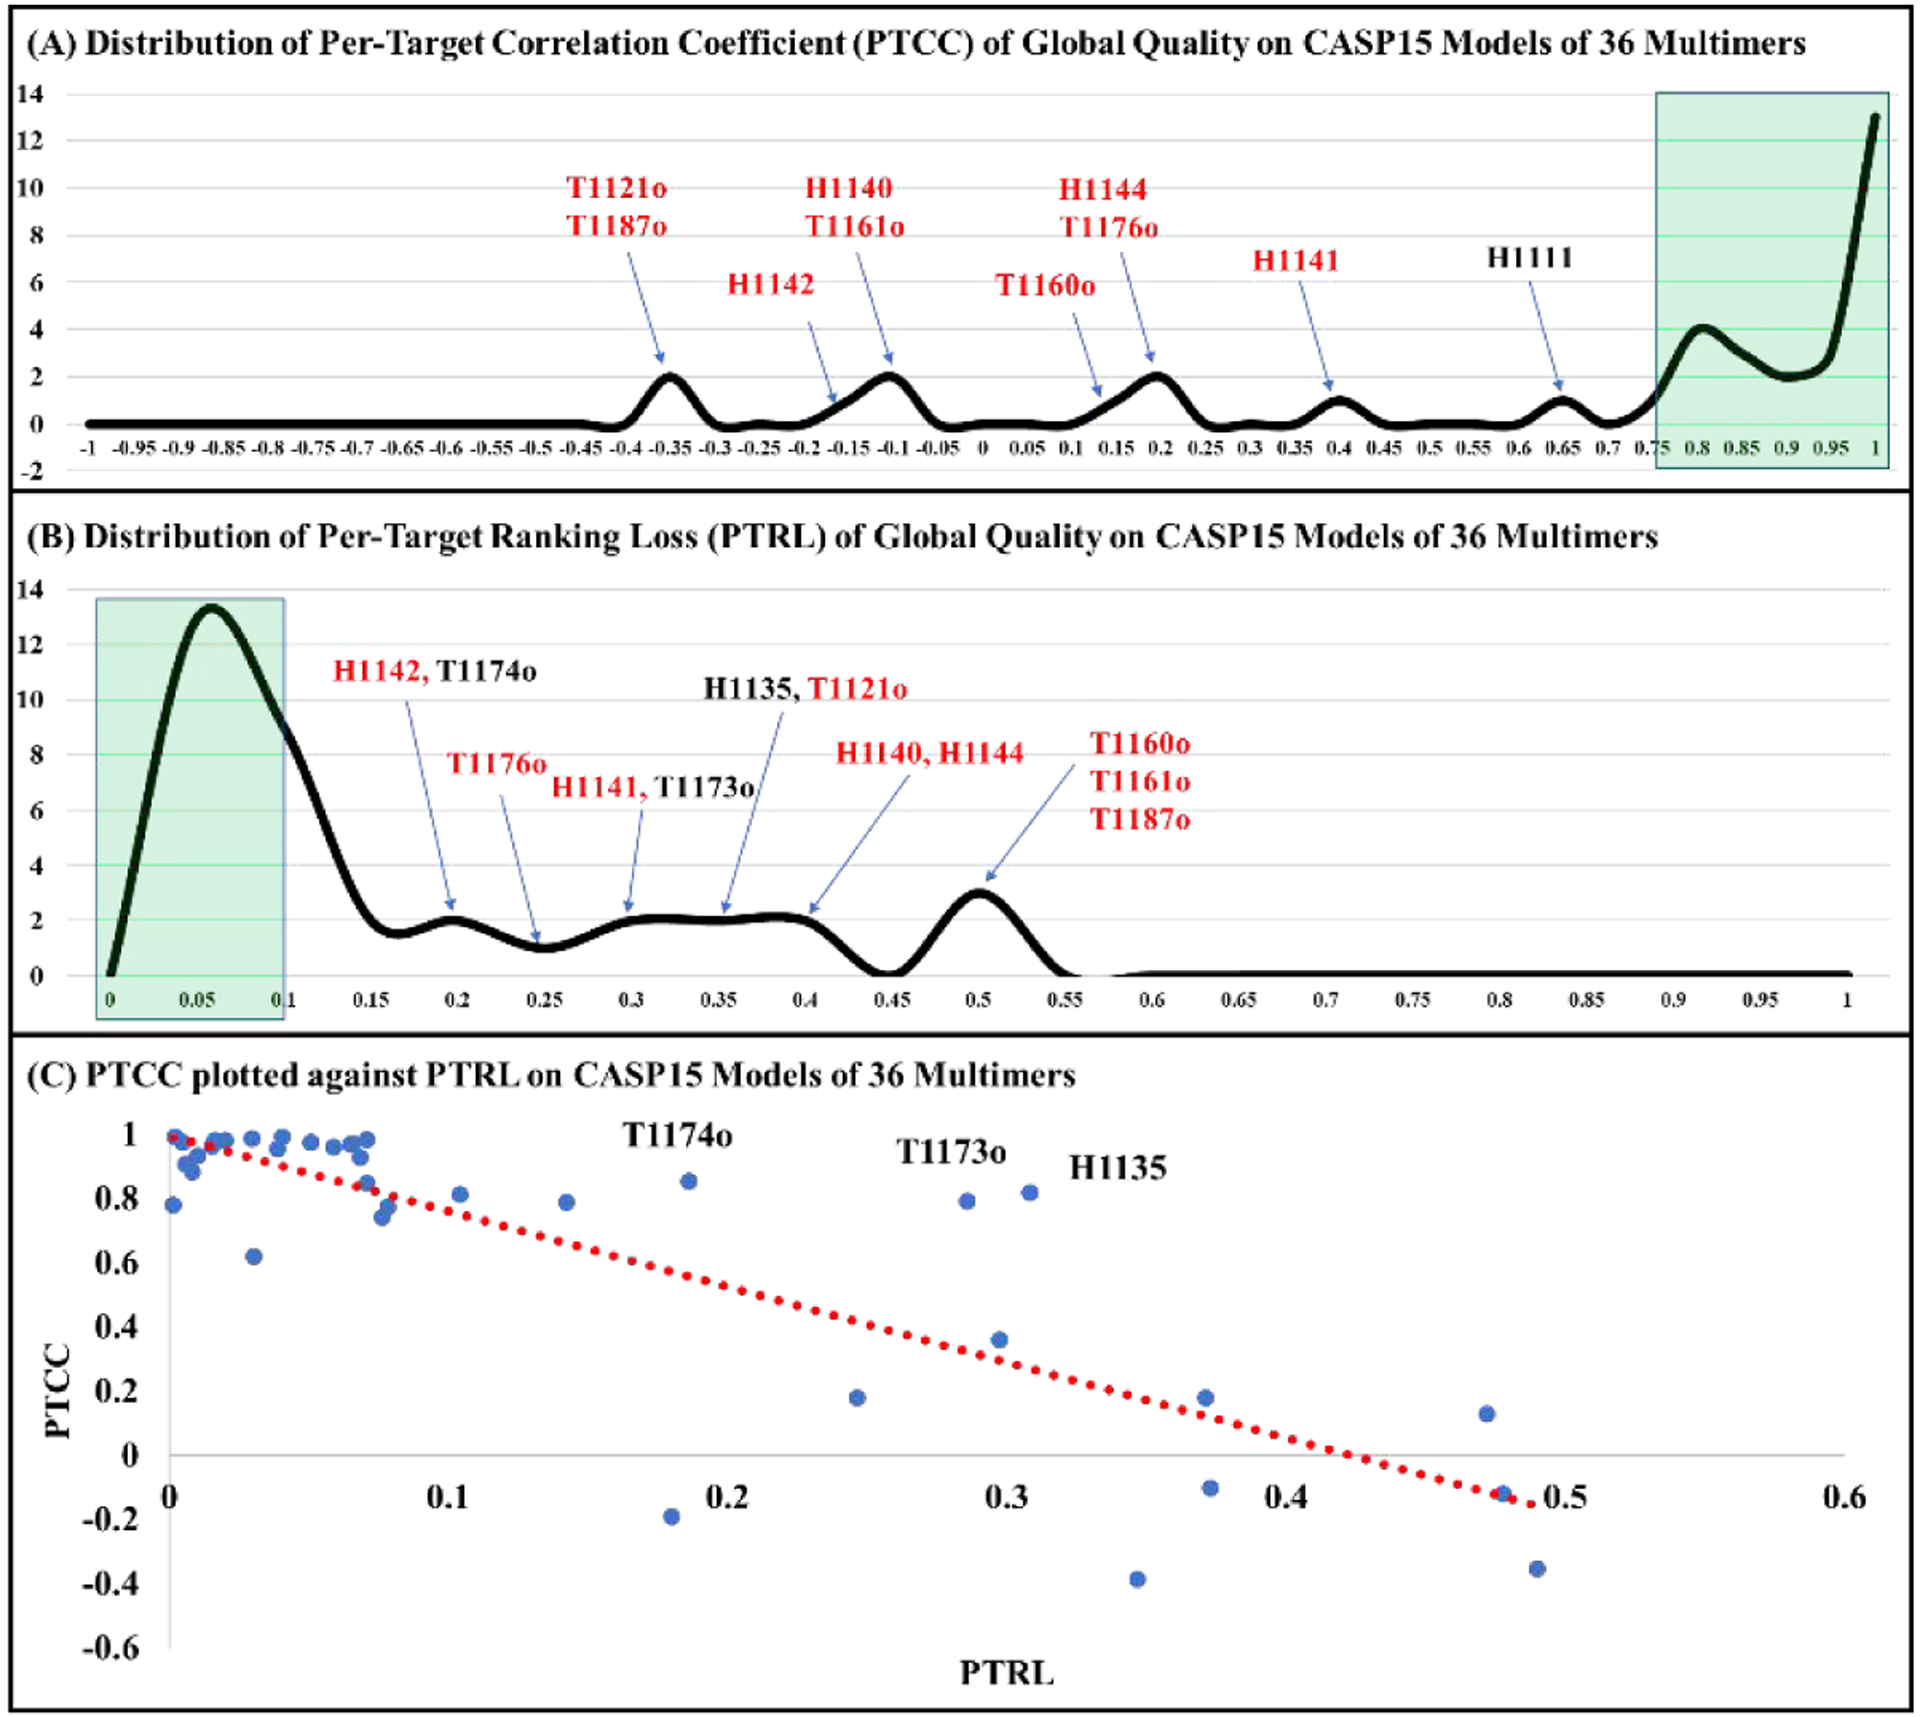
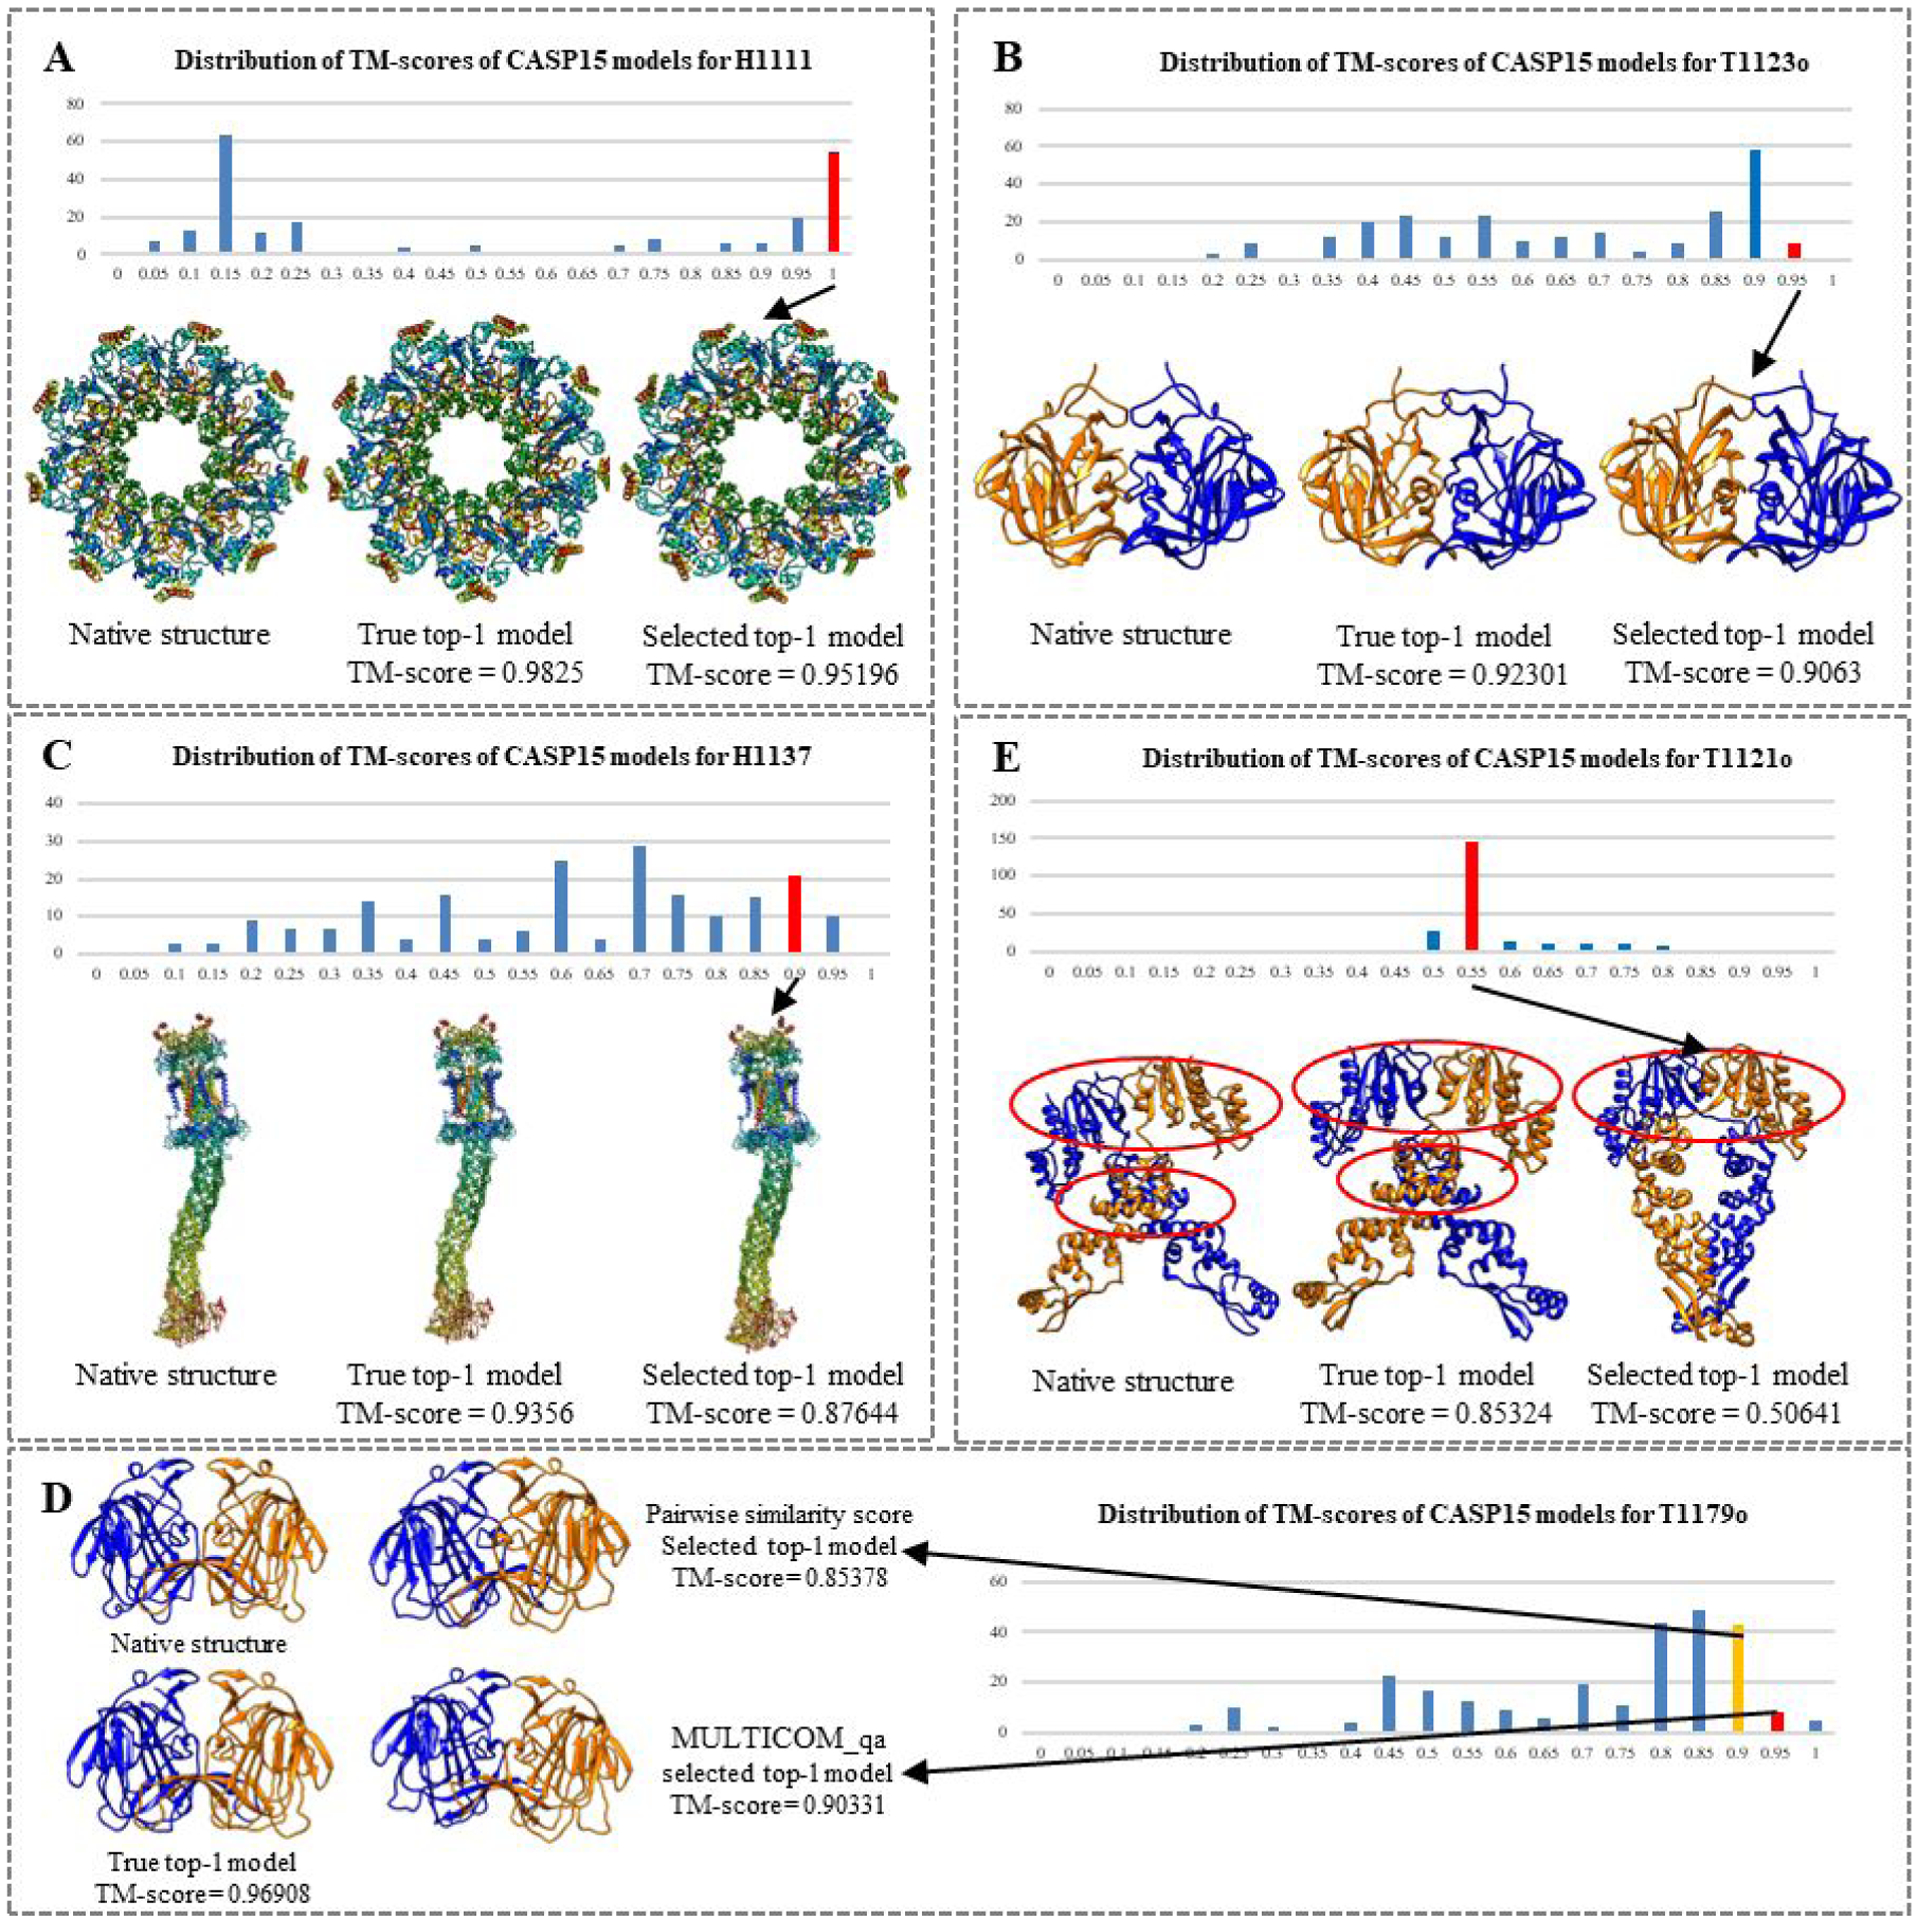
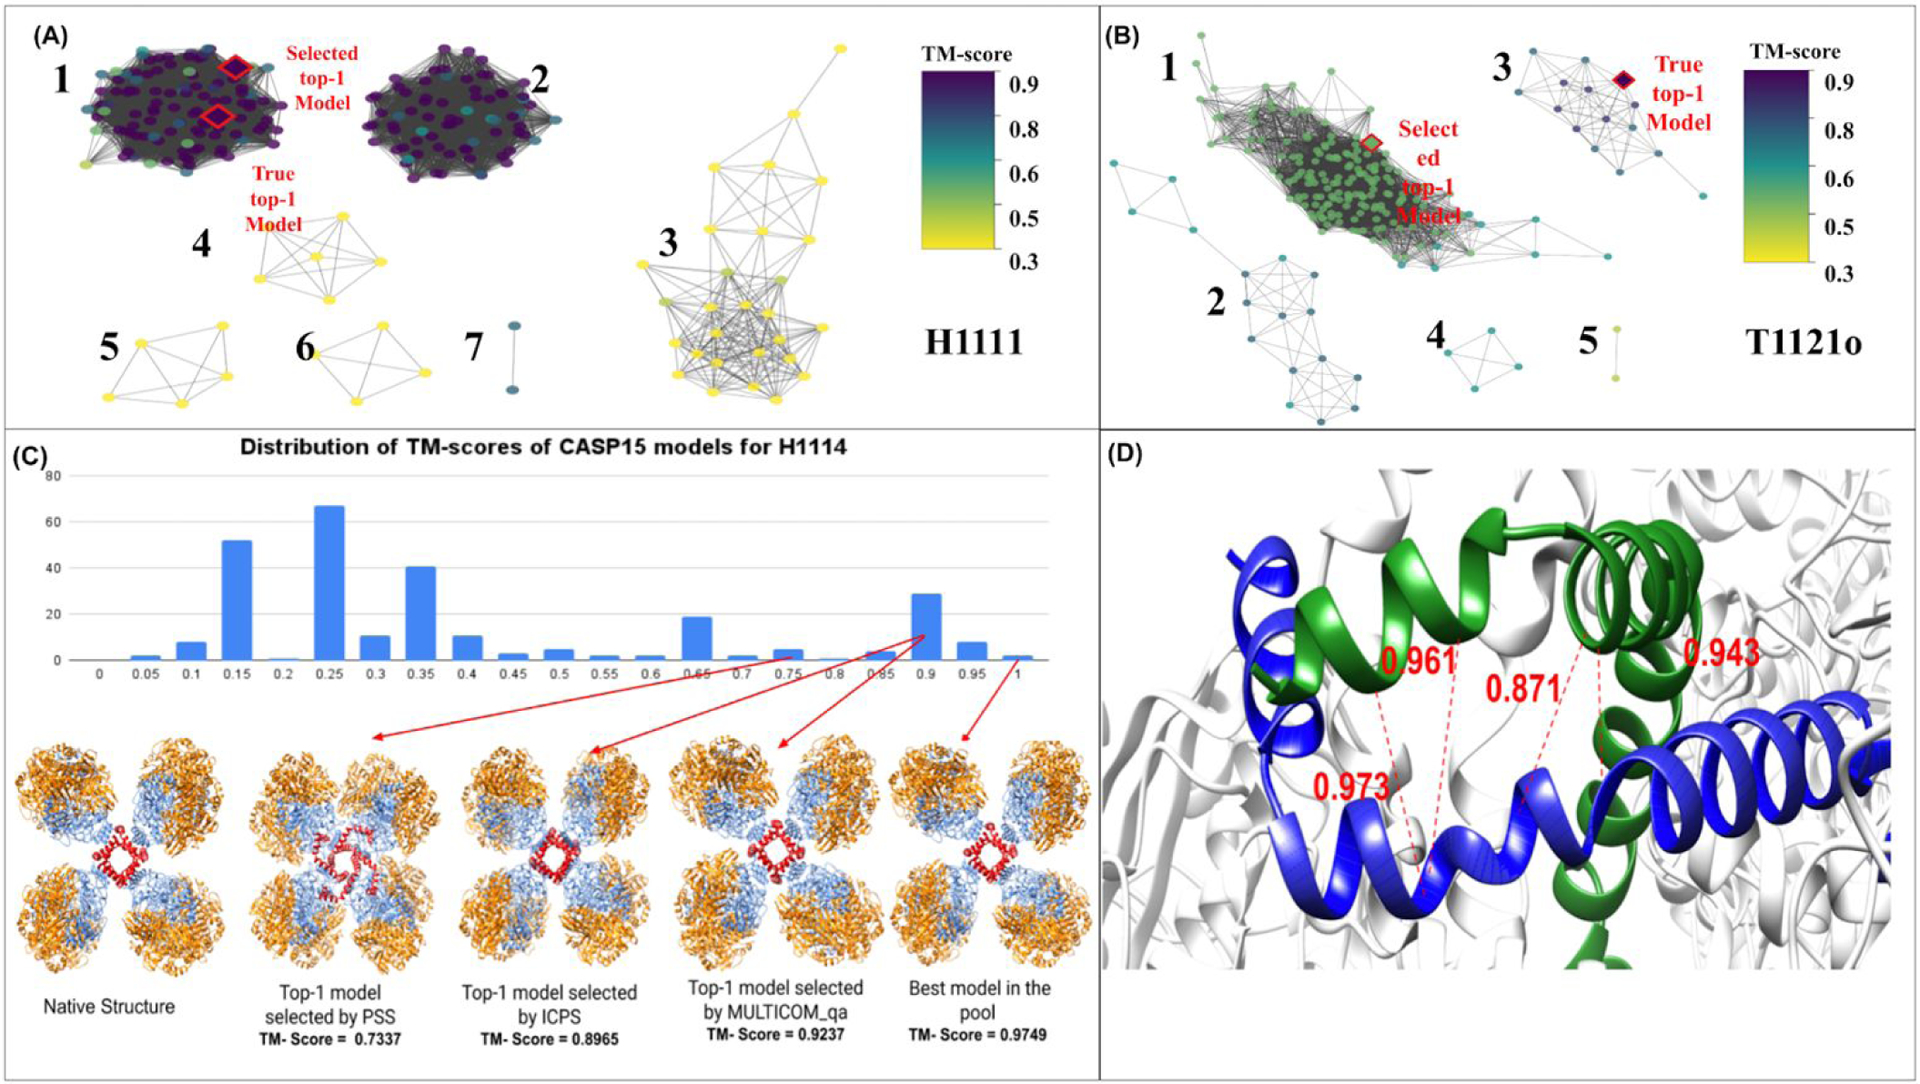
Estimating the accuracy of quaternary structural models of protein complexes and assemblies (EMA) is important for predicting quaternary structures and applying them to studying protein function and interaction. The pairwise similarity between structural models is proven useful for estimating the quality of protein tertiary structural models, but it has been rarely applied to predicting the quality of quaternary structural models. Moreover, the pairwise similarity approach often fails when many structural models are of low quality and similar to each other. To address the gap, we developed a hybrid method (MULTICOM_qa) combining a pairwise similarity score (PSS) and an interface contact probability score (ICPS) based on the deep learning inter-chain contact prediction for estimating protein complex model accuracy. It blindly participated in the 15th Critical Assessment of Techniques for Protein Structure Prediction (CASP15) in 2022 and performed very well in estimating the global structure accuracy of assembly models. The average per-target correlation coefficient between the model quality scores predicted by MULTICOM_qa and the true quality scores of the models of CASP15 assembly targets is 0.66. The average per-target ranking loss in using the predicted quality scores to rank the models is 0.14. It was able to select good models for most targets. Moreover, several key factors (i.e., target difficulty, model sampling difficulty, skewness of model quality, and similarity between good/bad models) for EMA are identified and analyzed. The results demonstrate that combining the multi-model method (PSS) with the complementary single-model method (ICPS) is a promising approach to EMA.

Keywords: deep learning; estimation of protein model accuracy; protein interface contact prediction; protein model quality assessment; protein quaternary structure prediction.


Conflict of interest statement

Conflict of Interest

The authors declare that there is no conflict of interest.

Figures

Figure 1:
Figure 1:
(A)A simplified illustration of the ICPS calculation. (i) A dimer model with chain A in red and chain B in blue. (ii) All the inter-chain contacts from a dimeric interface of the model are identified, which are coloured in red and blue. (iii) The green lines highlight some inter-chain contacts present in the interface. (iv) The predicted probability scores for the inter-chain contacts are extracted from the inter-chain contact map predicted by a deep learning predictor (CDPred). (v) The probability scores of the contacts in the interface are averaged as ICPS for the model. (B) The pipeline of MULTICOM_qa for estimating CASP15 assembly model accuracy. The input is a pool of assembly models for a target and other related information such as the stoichiometry of the target, protein sequences, predicted tertiary structures for each unit in the target, and the number of CPU cores. Multiple CPU cores can be used to speed up the calculation of the pairwise similarity scores between assembly models. PSS and ICPS for each model are computed and then averaged as the predicted global fold accuracy score for the model. The ICPS score is also used as the predicted interface score for each model.
Figure 2.
Figure 2.
The overall performance of MULTICOM_qa on the models of 36 CASP15 multimer targets. (A) Distribution of the per-target correlation coefficient between MULTICOM_qa predicted and true global quality scores (PTCC). The green area contains targets with high PTCC > 0.75. Several targets with low/moderate correlation coefficients are labelled. The average PTCC on the 36 targets is 0.6626. (B) Distribution of the per-target ranking loss (PTRL). The green area contains targets with low PTRL < 0.1. Several targets with high ranking loss are labelled. The red color highlights nine targets with both high ranking loss and low correlation. The average PTRL on the 36 targets is 0.1421. (C) PTCC is plotted against PTRL on the 36 multimer targets. The general trend is that a higher PTCC corresponds to a lower PTRL (correlation between them = −0.84). However, there are three pronounced exceptions (T1174o, T1173o and H1135) with both high correlation and high ranking loss.
Figure 3.
Figure 3.
Good and bad examples of applying MULTICOM_qa to estimate the accuracy of the models of CASP15 multimer targets. In each example, the distribution of the true TM-scores of the models for each target is visualized as histogram. The native structure, true top-1 (best) model, selected top-1 model, and the TM-scores of the latter two are presented. The bin in the histogram from which the top-1 model was selected by MULTICOM_qa is highlighted in red. (A) H1111: stoichiometry = A9B9C9, PTCC = 0.62, PTRL = 0.03054; (B) T1123o: stoichiometry = A2, PTCC = 0.98, PTRL = 0.01671; (C) H1137: stoichiometry = A1B1C1D1E1F1G2H1I1, PTCC = 0.96, PTRL = 0.05916; (D) T1179o, stoichiometry = A2, PTCC = 0.97, PTRL = 0.06577; (E) T1121o: stoichiometry = A2, PTCC = −0.39, PTRL = 0.34683; the correct interfaces are circled; and the top-1 model selected by MULTICOM_qa contains only one of the two correct interfaces, resulting in a high ranking loss of 0.34683.
None
Figure 4. (A) The model similarity graph for H1111. (B) The model similarity graph for T1121o. In a model similarity graph, each node denotes a model. An edge is used to connect two models (nodes) if their structural similarity score - TM-score is greater than a threshold. The threshold is determined such that only the top 30% of model pairs are connected by edges. The weight of each edge is TM-score between two nodes (models) calculated by MMalign, which is normalized by the total sequence length of the larger model if the two models have different sizes. The color of the nodes corresponds to the true TM-scores of the models. For H1111, both the best model (true top-1 model) and selected top-1 model come from the largest subgraph with the highest quality. For T1121o, the selected top-1 model is from the largest subgraph with mediocre quality, but the best model is in the third largest subgraph. (C) The distribution of TM-scores of the models of H1114 as well as its native structure, top-1 model selected by PSS, top-1 model selected by ICPS, top-1 model selected by MULTICOM_qa, and the best model in the model pool. Both ICPS and MULTICOM_qa selected a model that is much better than the model selected by PSS. The four A chains in the good models form a cube in the center (red), which is a key feature of the structure of H1114. (D) A homo-dimeric interface between two A chains of the top-1 model selected by ICPS for target H1114. The model is H1114TS119_2. The red lines represent the true inter-chain contacts in the interface. The numbers are the probabilities for the true contacts predicted by the CDPred. The true contacts have high predicted probabilities, leading to a high ICPS of 0.44 for the interface.

Update of

Similar articles

Cited by

References

    1. Basu S, & Wallner B (2016). DockQ: A Quality Measure for Protein-Protein Docking Models. PLOS ONE, 11(8), e0161879. 10.1371/journal.pone.0161879 - DOI - PMC - PubMed
    1. Bryant P, Pozzati G, Zhu W, Shenoy A, Kundrotas P, & Elofsson A (2022). Predicting the structure of large protein complexes using AlphaFold and Monte Carlo tree search. Nature Communications, 13(1), Article 1. 10.1038/s41467-022-33729-4 - DOI - PMC - PubMed
    1. Chen C, Chen X, Morehead A, Wu T, & Cheng J (2023). 3D-equivariant graph neural networks for protein model quality assessment. Bioinformatics, 39(1), btad030. 10.1093/bioinformatics/btad030 - DOI - PMC - PubMed
    1. Chen R, Li L, & Weng Z (2003). ZDOCK: An initial-stage protein-docking algorithm. Proteins: Structure, Function, and Bioinformatics, 52(1), 80–87. 10.1002/prot.10389 - DOI - PubMed
    1. Chen X, Morehead A, Liu J, & Cheng J (2022). DProQ: A Gated-Graph Transformer for Protein Complex Structure Assessment (p. 2022.05.19.492741). bioRxiv. 10.1101/2022.05.19.492741 - DOI - PMC - PubMed