. 2023 Aug;22(8):e13895.
doi: 10.1111/acel.13895. Epub 2023 Jun 26.

Reduction of class I histone deacetylases ameliorates ER-mitochondria cross-talk in Alzheimer's disease

Affiliations

Reduction of class I histone deacetylases ameliorates ER-mitochondria cross-talk in Alzheimer's disease

Daniela Marinho et al. Aging Cell. 2023 Aug.

Abstract

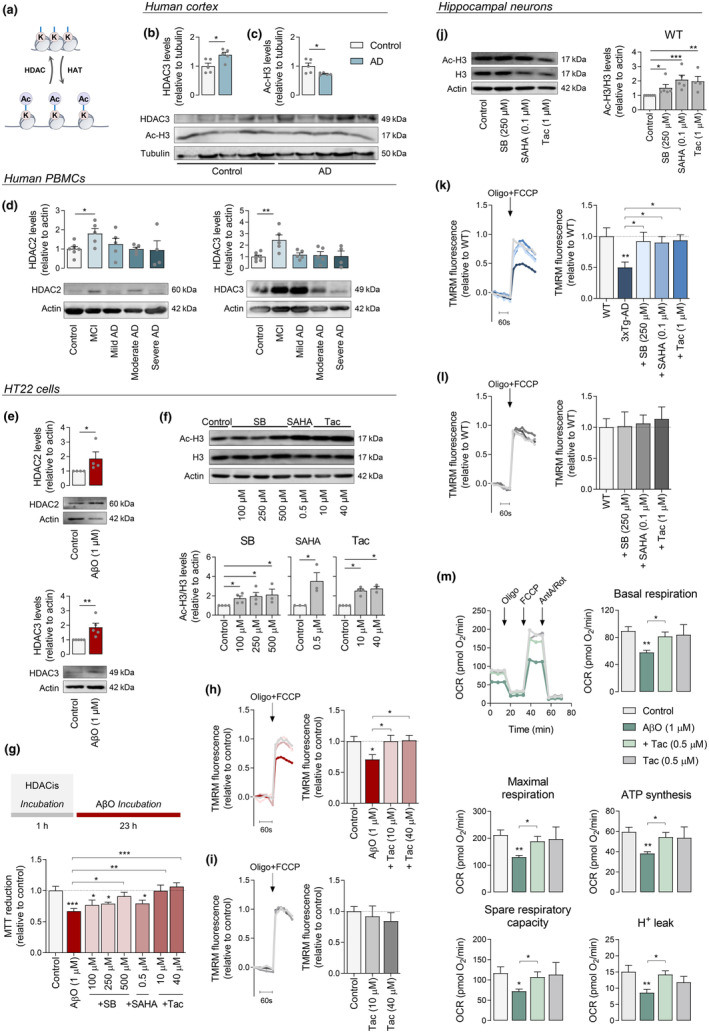
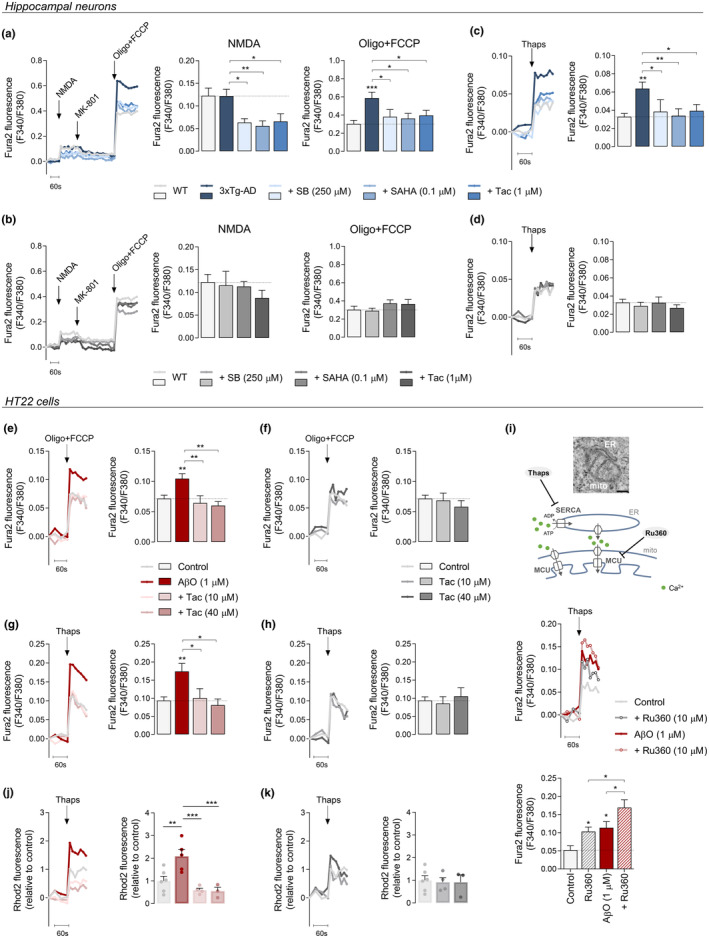
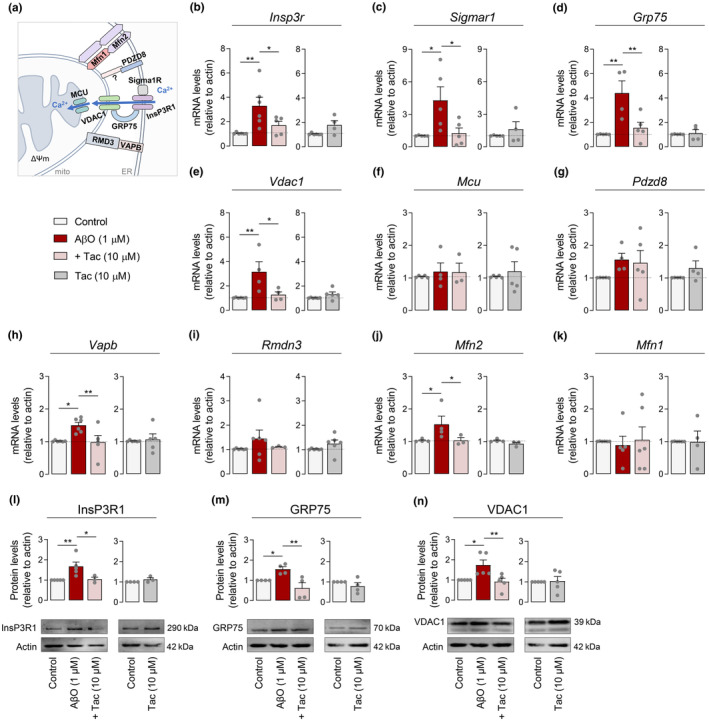
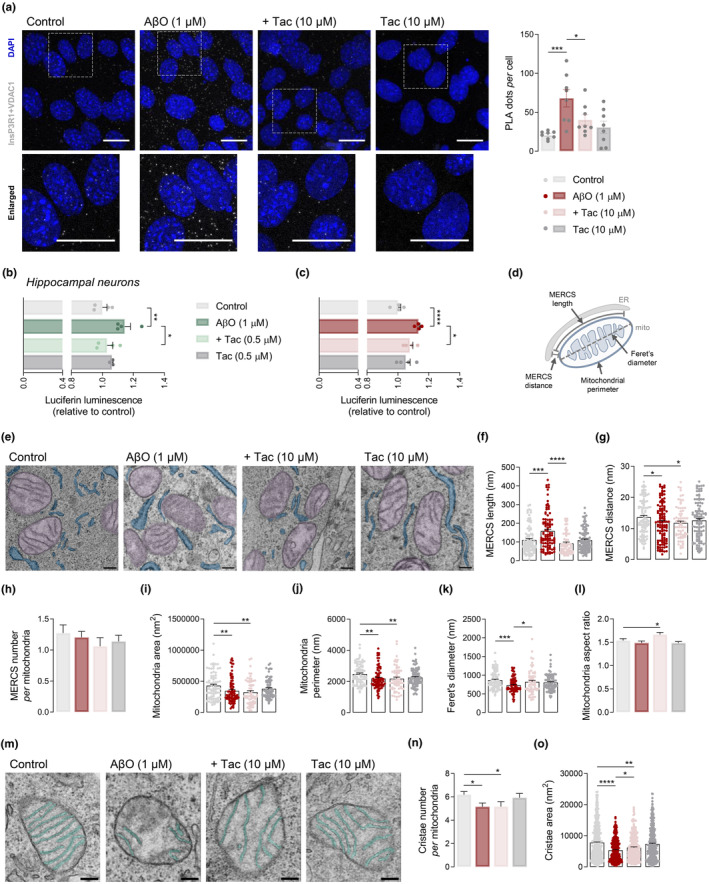
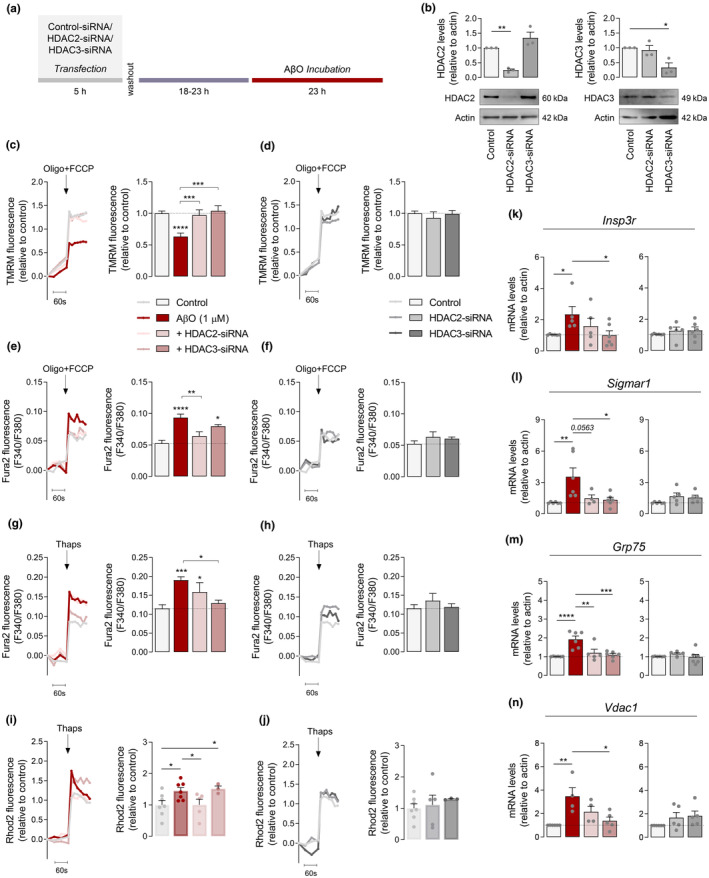
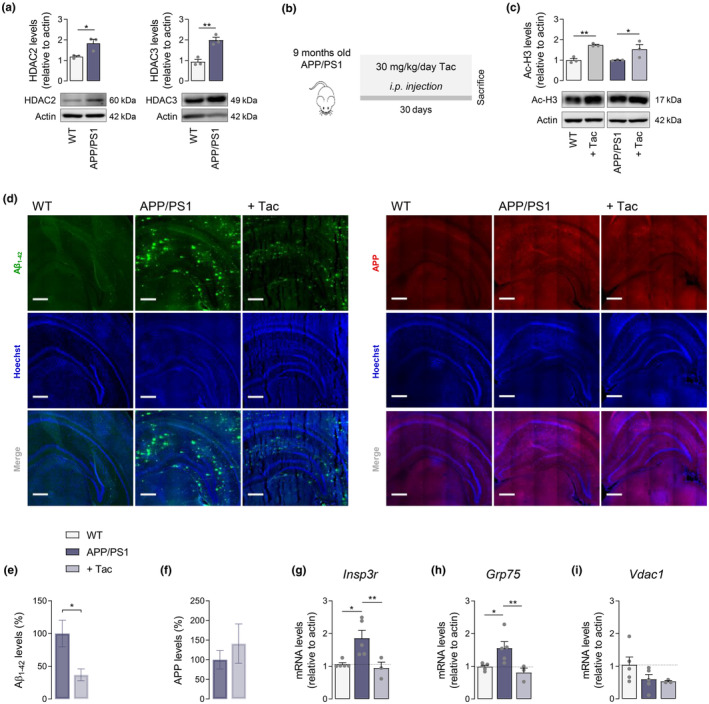
Several molecular mechanisms have been described in Alzheimer's disease (AD), including repressed gene transcription and mitochondrial and endoplasmic reticulum (ER) dysfunction. In this study, we evaluate the potential efficacy of transcriptional modifications exerted by inhibition or knockdown of class I histone deacetylases (HDACs) in ameliorating ER-mitochondria cross-talk in AD models. Data show increased HDAC3 protein levels and decreased acetyl-H3 in AD human cortex, and increased HDAC2-3 in MCI peripheral human cells, HT22 mouse hippocampal cells exposed to Aβ1-42 oligomers (AβO) and APP/PS1 mouse hippocampus. Tacedinaline (Tac, a selective class I HDAC inhibitor) counteracted the increase in ER-Ca2+ retention and mitochondrial Ca2+ accumulation, mitochondrial depolarization and impaired ER-mitochondria cross-talk, as observed in 3xTg-AD mouse hippocampal neurons and AβO-exposed HT22 cells. We further demonstrated diminished mRNA levels of proteins involved in mitochondrial-associated ER membranes (MAM) in cells exposed to AβO upon Tac treatment, along with reduction in ER-mitochondria contacts (MERCS) length. HDAC2 silencing reduced ER-mitochondria Ca2+ transfer and mitochondrial Ca2+ retention, while knockdown of HDAC3 decreased ER-Ca2+ accumulation in AβO-treated cells. APP/PS1 mice treated with Tac (30 mg/kg/day) also showed regulation of mRNA levels of MAM-related proteins, and reduced Aβ levels. These data demonstrate that Tac normalizes Ca2+ signaling between mitochondria and ER, involving the tethering between the two organelles in AD hippocampal neural cells. Tac-mediated AD amelioration occurs through the regulation of protein expression at MAM, as observed in AD cells and animal models. Data support transcriptional regulation of ER-mitochondria communication as a promising target for innovative therapeutics in AD.

Keywords: amyloid beta peptide; calcium; histone deacetylases; mitochondria; mitochondrial-associated ER membranes; tacedinaline.


Conflict of interest statement

The authors confirm that there are no financial or non‐financial competing interests to report.

Figures

FIGURE 1
FIGURE 1
Levels of HDAC2 and HDAC3 and effect of HDACis on acetyl‐H3 levels, AβO‐induced toxicity, and mitochondrial function. Scheme of histone acetylation/deacetylation (a) Western blotting analysis of HDAC3 (b) and acetyl‐H3 (c) protein levels in postmortem brain cortex derived from control individuals or AD patients. Data are the mean ± SEM of 5 individuals per group. Western blotting analysis of HDAC2 and HDAC3 protein levels in PBMCS derived from control individuals, MCI or AD patients. Data are the mean ± SEM of 4–10 individuals per group (d). HT22 cells were treated for 23 h with 1 μM AβO. Western blotting analysis of HDAC2 and HDAC3 protein levels (e). Cells were treated for 24 h with HDACis (SB, SAHA and Tac at the indicated concentrations). Western blotting analysis of acetyl‐H3 protein levels (f). Cells were pre‐exposed for 1 h with HDACis and then co‐treated with 1 μM AβO for the remaining 23 h of incubation. Cell metabolic activity was measured using the MTT assay (g). Representative TMRM+ fluorescence trace and peak amplitude after oligo plus FCCP stimulation in the presence (h) or absence (i) of AβO. Hippocampal neurons were treated for 24 h with HDACis (250 μM SB; 0.1 μM SAHA or 1 μM Tac). Western blotting analysis of acetyl‐H3 protein levels (j). Representative TMRM+ fluorescence trace and peak amplitude in response to maximal mitochondrial depolarization induced by oligo plus FCCP (2 μg/mL; 2 μM) in 3xTg‐AD (k) and WT (l) neurons. WT hippocampal neurons were pre‐treated for 1 h with Tac (0.5 μM) and then co‐incubated with 1 μM AβO for the remaining 23 h. Basal respiration, maximal respiration, ATP production (oligomycin‐sensitive respiration), spare respiratory capacity, and H+ leak were quantified using a Seahorse analyzer (m). HT22 cells (f–i) were pre‐treated for 1 h with Tac (10 or 40 μM) and then co‐incubated with 1 μM AβO for the remaining 23 h. Representative F340/380 fluorescence trace and peak amplitude after oligo plus FCCP stimulation in the presence (h) or absence (i) of AβO. Data are the mean ± SEM of 3–7 independent experiments, run in triplicates to quadruplicates. Statistical analysis: Kruskal–Wallis followed by uncorrected Dunn's multiple comparison test, one‐way ANOVA followed by uncorrected Fisher's LSD multiple comparison test, Mann–Whitney test and unpaired Student's t‐test; *p < 0.05; **p < 0.01; ***p < 0.001 when compared to the control.
FIGURE 2
FIGURE 2
Effect of HDACis on ER‐mitochondria Ca2+ transfer in hippocampal neurons and AβO‐treated cells. Hippocampal neurons (a–d) were treated for 24 h with HDACis (250 μM SB; 0.1 μM SAHA or 1 μM Tac). Representative F340/380 fluorescence trace and peak amplitude in response to 100 μM NMDA stimulation and to maximal mitochondrial depolarization induced by oligo plus FCCP (2 μg/mL; 2 μM) in 3xTg‐AD (a) and WT (b) neurons following HDACis pre‐treatment. Representative F340/380 fluorescence trace and peak amplitude in response to ER‐Ca2+ storage depletion induced by thapsigargin (1 μM) in 3xTg‐AD (c) and WT (d) neurons. HT22 cells (e–k) were pre‐treated for 1 h with Tac (10 or 40 μM) and then co‐incubated with 1 μM AβO for the remaining 23 h. Representative F340/380 fluorescence trace and peak amplitude after oligo plus FCCP stimulation in the presence (e) or absence (f) of AβO. Representative F340/380 fluorescence trace and peak amplitude following thapsigargin stimulus in the presence (g) or absence (h) of AβO. Representative F340/380 fluorescence trace and peak amplitude in response to thapsigargin stimulation following a pre‐incubation with Ru360 (MCU inhibitor; 10 μM) (i). Representative Rhod2 fluorescence trace and peak amplitude after thapsigargin stimulation in the presence (j) or absence (k) of AβO. Data are the mean ± SEM of 3–8 independent experiments, run in triplicates to quadruplicates. Statistical analysis: Kruskal–Wallis followed by uncorrected Dunn's multiple comparison test, one‐way ANOVA followed by uncorrected Fisher's LSD multiple comparison test; *p < 0.05; **p < 0.01; ***p < 0.001 when compared to control.
FIGURE 3
FIGURE 3
Tac effect on MAM‐related proteins in AβO‐treated cells. Schematic representation of proteins at MAM (a). HT22 cells were pre‐treated for 1 h with Tac (10 μM) and then co‐incubated with 1 μM AβO for the remaining 23 h or treated solely with Tac for 24 h. Relative expression of Insp3r (b), Sigmar1 (c), Grp75 (d), Vdac1 (e), Mcu (f), Pdzd8 (g), Vapb (h), Rmdn3 (i), Mfn2 (j), and Mfn1 (k) mRNA. Western blotting analysis of InsP3R1 (l), GRP75 (m), and VDAC1 (n) protein levels. Actin was used as the housekeeping messenger and the loading control. Data are the mean ± SEM of 3–6 independent experiments, run in triplicates to quadruplicates. Statistical analysis: Kruskal–Wallis test followed by uncorrected Dunn's multiple comparisons test, one‐way ANOVA followed by uncorrected Fisher's LSD multiple comparison test, Mann–Whitney test and unpaired Student's t‐test; *p < 0.05; **p < 0.01 when compared to control.
FIGURE 4
FIGURE 4
Tac effect on InsP3R1‐VDAC1 interaction and MERCS morphology in AβO‐treated cells. HT22 cells were pre‐treated for 1 h with Tac (10 μM) and then co‐incubated with 1 μM AβO for the remaining 23 h or treated solely with Tac for 24 h. Representative confocal images of in situ PLA signal (gray) indicating a physical interaction between InsP3R1 and VDAC1 (scale bar = 20 μm). The lower panels represent enlargements of the boxed areas in the upper panels. Quantification of number of PLA puncta in about 200–240 cells from 8 image stacks per condition (a). WT hippocampal neurons were pre‐treated for 1 h with Tac (0.5 μM) and then co‐incubated with 1 μM AβO for the remaining 23 h or treated solely with Tac for 24 h. NFAT transcriptional activity evaluated by luciferase reporter assay in hippocampal neurons (b) and HT22 cells (c). Data are the mean ± SEM of 4 independent experiments, run in triplicates to quadruplicates. Schematic representation of MERCS structural parameters: MERCS length and distance, mitochondrial perimeter and Feret's diameter (d). HT22 cells were pre‐treated for 1 h with Tac (10 μM) and then co‐incubated with 1 μM AβO for the remaining 23 h. Representative TEM images of mitochondria (in purple) in close contact with ER (in blue) (scale bar = 200 nm) in which distances ≤25 nm were considered as contacts (e). MERCS length (f) and distance (g), number of MERCS per mitochondria (h), mitochondrial area (i) and perimeter (j), Feret's diameter (k) and mitochondrial aspect ratio (l). Representative TEM images of mitochondrial cristae (in green) (scale bar = 200 nm) (m). Number of cristae per mitochondria (n), and cristae area (o). About 70–90 individual mitochondria from 10 randomly selected cells obtained from approximately 30 images were assessed in 26–38 independent TEM images. Statistical analysis: Kruskal–Wallis test followed by uncorrected Dunn's multiple comparisons test, one‐way ANOVA followed by uncorrected Fisher's LSD multiple comparison test; *p < 0.05; **p < 0.01; ***p < 0.0001; ****p < 0.0001 when compared to control.
FIGURE 5
FIGURE 5
HDAC2/3 knockdown effect on mitochondrial membrane potential, Ca2+ i levels and MAM proteins in AβO‐treated cells. HT22 cells were transfected with either HDAC2‐ or HDAC3‐siRNA. Scrambled siRNA was used as a control. After transfection, cells were treated with 1 μM AβO and incubated for additional 24 h (a). Western blotting analysis of HDAC2 and HDAC3 proteins levels 48 h after transfection with HDAC2‐ or HDAC3‐siRNA (b). Representative trace of TMRM+ fluorescence and peak amplitude relative to control in response to maximal mitochondrial depolarization induced by oligo (2 μg/mL) plus FCCP (2 μM) in the presence (c) or absence (d) of AβO. Representative F340/380 fluorescence trace and peak amplitude after oligo plus FCCP stimulus in the presence (e) or absence (f) of AβO. Representative F340/380 fluorescence trace and peak amplitude in response to ER‐Ca2+ storage depletion induced by thapsigargin in the presence (g), or absence (h) of AβO. Representative Rhod2 fluorescence trace and peak amplitude after thapsigargin stimulation in the presence (i) or absence (j) of AβO. Relative expression of Insp3r (k), Sigmar1 (l), Grp75 (m), and Vdac1 (n) mRNA. Actin was used as the housekeeping messenger and the loading control. Data are the mean ± SEM of 3–7 independent experiments, run in triplicates to quadruplicates. Statistical analysis: Kruskal–Wallis test followed by uncorrected Dunn's multiple comparisons test and one‐way ANOVA followed by uncorrected Fisher's LSD multiple comparison test; *p < 0.05; **p < 0.01; ***p < 0.001; ****p < 0.0001 when compared to control.
FIGURE 6
FIGURE 6
Effect of Tac on Aβ levels and expression of genes involved in ER‐mitochondria Ca2+ communication in the hippocampus of APP/PS1 mice. Western blotting analysis of HDAC2 and HDAC3 protein levels in 10 months old APP/PS1 and WT mice (a). APP/PS1 versus WT mice were treated with Tac (30 mg/kg/day) for 30 days (b). Western blotting analysis of acetyl‐H3 protein levels (c). Representative immunofluorescent images (d; scale bar = 100 μm; 25–30 coronal sections) and quantification of Aβ (e) and APP (f) levels. Relative expression of Insp3r (g), Grp75 (h), and Vdac1 (i) mRNA. Actin was used as the housekeeping messenger and the loading control. Data are the mean ± SEM of 3–5 mice per group. Statistical analysis: Kruskal–Wallis test followed by uncorrected Dunn's multiple comparisons test, one‐way ANOVA followed by uncorrected Fisher's LSD multiple comparison test and unpaired Student's t‐test; *p < 0.05; **p < 0.01 when compared to control.

References

    1. Albert, M. S. , DeKosky, S. T. , Dickson, D. , Dubois, B. , Feldman, H. H. , Fox, N. C. , Gamst, A. , Holtzman, D. M. , Jagust, W. J. , Petersen, R. C. , Snyder, P. J. , Carrillo, M. C. , Thies, B. , & Phelps, C. H. (2011). The diagnosis of mild cognitive impairment due to Alzheimer's disease: Recommendations from the National Institute on Aging‐Alzheimer's Association workgroups on diagnostic guidelines for Alzheimer's disease. Alzheimer's & Dementia, 7(3), 270–279. 10.1016/j.jalz.2011.03.008 - DOI - PMC - PubMed
    1. Area‐Gomez, E. , Del Carmen Lara Castillo, M. , Tambini, M. D. , Guardia‐Laguarta, C. , de Groof, A. J. , Madra, M. , Ikenouchi, J. , Umeda, M. , Bird, T. D. , Sturley, S. L. , & Schon, E. A. (2012). Upregulated function of mitochondria‐associated ER membranes in Alzheimer disease. The EMBO Journal, 31(21), 4106–4123. 10.1038/emboj.2012.202 - DOI - PMC - PubMed
    1. Bartok, A. , Weaver, D. , Golenár, T. , Nichtova, Z. , Katona, M. , Bánsághi, S. , Alzayady, K. J. , Thomas, V. K. , Ando, H. , Mikoshiba, K. , Joseph, S. K. , Yule, D. I. , Csordás, G. , & Hajnóczky, G. (2019). IP3 receptor isoforms differently regulate ER‐mitochondrial contacts and local calcium transfer. Nature Communications, 10(1), 3726. 10.1038/s41467-019-11646-3 - DOI - PMC - PubMed
    1. Beaver, M. , Karisetty, B. C. , Zhang, H. , Bhatnagar, A. , Armour, E. , Parmar, V. , Brown, R. , Xiang, M. , & Elefant, F. (2022). Chromatin and transcriptomic profiling uncover dysregulation of the Tip60 HAT/HDAC2 epigenomic landscape in the neurodegenerative brain. Epigenetics, 17(7), 786–807. 10.1080/15592294.2021.1959742 - DOI - PMC - PubMed
    1. Beckers, T. , Burkhardt, C. , Wieland, H. , Gimmnich, P. , Ciossek, T. , Maier, T. , & Sanders, K. (2007). Distinct pharmacological properties of second generation HDAC inhibitors with the benzamide or hydroxamate head group. International Journal of Cancer, 121(5), 1138–1148. 10.1002/ijc.22751 - DOI - PubMed

Publication types