. 2023 Sep 6;13(9):2032-2049.
doi: 10.1158/2159-8290.CD-22-1297.

A Novel Type of Monocytic Leukemia Stem Cell Revealed by the Clinical Use of Venetoclax-Based Therapy

Affiliations

A Novel Type of Monocytic Leukemia Stem Cell Revealed by the Clinical Use of Venetoclax-Based Therapy

Shanshan Pei et al. Cancer Discov. .

Abstract

The BCL2 inhibitor venetoclax has recently emerged as an important component of acute myeloid leukemia (AML) therapy. Notably, use of this agent has revealed a previously unrecognized form of pathogenesis characterized by monocytic disease progression. We demonstrate that this form of disease arises from a fundamentally different type of leukemia stem cell (LSC), which we designate as monocytic LSC (m-LSC), that is developmentally and clinically distinct from the more well-described primitive LSC (p-LSC). The m-LSC is distinguished by a unique immunophenotype (CD34-, CD4+, CD11b-, CD14-, CD36-), unique transcriptional state, reliance on purine metabolism, and selective sensitivity to cladribine. Critically, in some instances, m-LSC and p-LSC subtypes can co-reside in the same patient with AML and simultaneously contribute to overall tumor biology. Thus, our findings demonstrate that LSC heterogeneity has direct clinical significance and highlight the need to distinguish and target m-LSCs as a means to improve clinical outcomes with venetoclax-based regimens.

Significance: These studies identify and characterize a new type of human acute myeloid LSC that is responsible for monocytic disease progression in patients with AML treated with venetoclax-based regimens. Our studies describe the phenotype, molecular properties, and drug sensitivities of this unique LSC subclass. This article is featured in Selected Articles from This Issue, p. 1949.


Conflict of interest statement

Conflict of interests: The authors declare no potential conflict of interests.

Figures

Fig. 1.
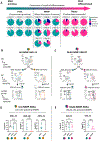
Fig. 1.. Characterization of developmentally heterogeneous LSCs.
A, Pie charts showing the relative proportion of cells at primitive (teal), monocytic (pink), lymphocytic (dark blue), and erythroid (gray) stages for each primary AML. B, C, Sorting strategy and engraftment of prim and mono subpopulations from representative Uni-MMP AML-12 and Multi-MMP AML-07, respectively. The CD45/SSC flow plots in the top row depict leukemia disease before sort; The CD45/SSC flow plots in the middle demonstrate cells post sort; The human-CD45/mouse-CD45 (hCD45/mCD45) flow plots in the bottom row show engraftment levels in bone marrow of representative recipient mice. Percentage of hCD45+/mCD45− cells were used to quantify engraftment levels. D, E, Summary of engraftment data for Uni-MMP (AML-12, AML-08, and AML-14) and Multi-MMP (AML-07 and AML-13), respectively. Bulk stands for unsorted bulk tumor; prim stands for primitive subpopulation; mono stands for monocytic subpopulation. Each dot represents a mouse. AML-12 (bulk, n=7; prim, n=6; mono, n=6). AML-08 (prim, n=7; mono, n=9). AML-14 (prim, n=9; mono, n=7). AML-07 (bulk, n=7; prim, n=5; mono, n=6). AML-13 (prim, n=8; mono, n=8). Median+/− interquartile range. Two-tailed Mann-Whitney tests were used for comparing two groups, Kruskal-Wallis tests were used when comparing more than two groups. ns, not significant.
Fig. 2.
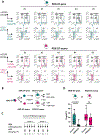
Fig. 2.. Differing nature of disease arising from prim and mono subpopulations of Multi-MMP AMLs.
A, Representative flow plots showing immunophenotypic differences between leukemia arising from prim and mono subpopulations of Multi-MMP AML-07 in NSG-S mice. Five representative mice from each group are shown. For each mouse, engrafted human leukemic cells were gated as hCD45+/mCD45− (teal and pink gates) and their expression pattern of CD34 and CD117 were shown to illustrate immunophenotypic differences between the two groups. B, A diagram depicting workflow used to isolate primitive and monocytic subpopulations of AML-07 for injecting into PDX mice and subsequent determination of their relative sensitivity to the VEN+AZA regimen in vivo. C, Design of the VEN/AZA in vivo regimen. D, Impact of in vivo VEN+AZA treatments on leukemia engrafted from prim versus mono subpopulations of AML-07. Engraft% was determined by % of hCD45+/mCD45− cells within total viable bone marrow cells. Each dot represents a unique mouse. PDX-07-prim (Control, n=10; VEN/AZA, n=10), PDX-07-mono (Control, n=10; VEN/AZA, n=10). Box plots show median +/− interquartile. Two-tailed Mann-Whitney test was used. ns, not significant.
Fig. 3.
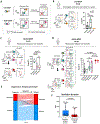
Fig. 3.. Clinical outcomes as a function of m-LSCs.
A, A diagram describing the leukemogenesis process of Uni-MMP and Multi-MMP AML patients and their predicted clinical responses to VEN+AZA therapy. B-D, Representative cases of Uni-MMP and Multi-MMP AML patients received VEN+AZA therapy. The left panels depict sorting strategies for obtaining diagnosis-prim (Dx-prim) and diagnosis-mono (Dx-mono) subpopulations from diagnosis bulk disease (Dx-bulk), as well as relapse-mono (Rl-mono) subpopulations from relapse bulk disease (Rl-bulk) when applicable. The right panel shows engraft% in NSG-S mice determined by hCD45+/mCD45−% within total viable bone marrow cells. Each dot represents a unique mouse. Median +/− interquartile. Mann-Whitney tests. ns, not significant. B, Patient 20 (Pt-20), a case of Uni-MMP AML presenting prolonged remission after VEN+AZA therapy for more than 3.5 years. Dx-bulk (n=9), Dx-prim (n=7), Dx-mono (n=7). C, Patient 12 (Pt-12), a case of Multi-MMP AML presenting predominant monocytic relapse in 12 months after receiving VEN+AZA therapy. Dx-prim (n=10), Dx-mono (n=9), Rl-mono (n=8). D, Patient 69 (Pt-69), a case of Multi-MMP AML presenting quick relapse in 3 months post VEN+AZA therapy. In this particular case, prim and mono subpopulations were gated using a different sorting strategy based on primitive antigen CD34 and monocytic antigen CD11b. For the patient’s diagnosis sample, the CD34+/CD11b−, CD34+/CD11b+, and CD34−/CD11b−pp subpopulations were sorted as Dx-prim-A, Dx-prim-B, and Dx-mono subpopulations, respectively. For the patient’s relapse sample, the CD34−/CD11b−pp subpopulation was sorted as the predominant Rl-mono subpopulation. Dx-bulk (n=9), Dx-prim-A (n=3), Dx-prim-B (n=7), Dx-mono (n=7), Rl-bulk (n=9), Rl-mono (n=9). E, Phenotypic changes from diagnosis to relapse in a cohort of AML patients received VEN+AZA therapy (N=25). F, Remission duration for AML patients with monocytic relapse (N=9) versus non-monocytic relapse (N=16). Each dot represents a unique patient. Median duration time of both groups are shown in days. In B-D, and F, box plots represent median +/− interquartile. In B-D, Kruskal-Wallis test was used. In F, one-tailed Mann-Whitney test was used. ns, not significant.
Fig. 4.
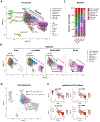
Fig. 4.. Identification of the m-LSC immunophenotype.
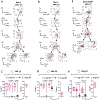
A, A UMAP of primary AML specimens (N=27) containing cells of myeloid, lymphoid, and erythroid lineages. Dotted lines highlight the myeloid subpopulation. The colored arrow indicates myeloid developmental hierarchy as revealed by scArches analysis. B, UMAPs of immunophenotypically and functionally determined Prim, Uni-MMP, Multi-MMP and Mono AMLs. Dotted lines highlight areas potentially enriched for p-LSCs and m-LSCs. The colored arrows demonstrate differing developmental hierarchies among the groups. C, Stacking bar graphs showing relative proportion of each subcluster within the myeloid subpopulation. In B and C, the asterisks mark the cell type that is thought to be enriched for m-LSCs. D, Scoring of CD34+_LSC and KMT2A-r_LSC signatures on the UMAP. E, Protein expression of surface antigens CD4, CD14, CD11b, and CD36 from CITE-seq analysis.
Fig. 5.
Fig. 5.. Functional validation of m-LSC immunophenotypes.
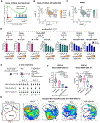
A, B, Gating strategies for sorting various subpopulations of Mono AML-16 and Mono AML-20 for determining their m-LSC activities using xenograft studies. The sorting is detailed in Supplementary Figures. Briefly, for both specimens, A (Live/mono/CD34−), B (Live/mono/CD34−/CD4+/CD14−), C (Live/mono/CD34−/CD4+/CD14+), D (Live/mono/CD34−/CD4+/CD14−/CD11b−CD36−), and E (Live/mono/CD34−/CD4+/CD14−/CD11b+CD36+) were sorted and engrafted. C, D, Results from transplanting subpopulations of AML-16 (A(n=8), B(n=6), C(n=7), D(n=7), E(n=6)) and AML-20 (A(n=9), B(n=8), C(n=7), D(n=12), E(n=10)) are shown as PDX-16 and PDX-20, respectively. E, Gating strategies for Multi-MMP AML-07. CD4 was not included in the sort due to the limitation of cells. F, Results from transplanting subpopulations of AML-07 (A(n=10), B(n=10), C(n=9), D(n=10), E(n=8)) are shown as PDX-07. In C, D, and F, Engraft% was determined by % of hCD45+/mCD45− cells within total viable bone marrow cells. Each dot represents a unique mouse. Box plots represent median +/− interquartile. Two-tailed Mann-Whitney tests.
Fig. 6.
Fig. 6.. Molecular properties and targeting of m-LSCs.
A, A GSEA enrichment plot showing upregulation of the purine metabolism pathway in m-LSCs relative to p-LSCs. B-C, Scoring of the purine metabolism pathway and expression of HPRT1 on UMAP. D, Impact of cladribine (CdA) on colony-forming unit (CFU) potential of m-LSCs, p-LSCs and CD34+ HSPCs sorted from Mono (AML-16, AML-20), Multi-MMP (AML-23), Prim (AML-03) and two normal mobilized peripheral blood samples (MPB-1, 2). E, A diagram depicting workflow and design of the regimens used for in vivo treatment. F, Impact of in vivo VEN+AZA, CdA or triple drug combo treatments on the bone marrow tumor burden of PDX. Engraft% was determined by % of hCD45+/mCD45− cells within total viable bone marrow mononuclear cells. Each dot represents a unique mouse. For PDX of AML-13, Control (n=11), VEN+AZA (n=9), CdA (n=10), VEN+AZA+CdA (n=10). For PDX of AML-07, Control (n=11), VEN+AZA (n=9), CdA (n=12), VEN+AZA+CdA (n=9). Box plots represent median +/− interquartile. Kruskal-Wallis test was used. ns, not significant. G, tSNE analysis of immunophenotypic data of residual live engrafted cells from PDX of AML-13 post treatment.
Fig. 7.
Fig. 7.. A model depicting m-LSC driven relapse/refractory responses to venetoclax-based therapy.
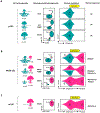
A, A first group of AML patients with disease solely driven by p-LSCs captured at various maturation stages with predominant Prim, MMP, and predominant Mono immunophenotypes. The majority of these p-LSCs are expected to be BCL2-dependent, rendering a high complete remission (CR) rate in this group of patients. B, A second group of AML patients with multi-LSC activities (contains both p-LSCs and m-LSCs) presenting Prim, MMP, or Mono immunophenotypes depending on the relative degrees of maturation and ratio of the two diseases rooted from the two distinct LSC subtypes. These patients are expected to have a higher tendency to develop relapse/refractory responses to VEN+AZA due to the nature of m-LSCs described in the current study. C, A last group of AML patients with disease solely driven by m-LSCs usually presenting a predominant mono immunophenotype due to the inherent nature of m-LSCs that are already resting at a relatively more mature promyelocyte-like developmental stage. This group of patients have a high tendency to develop refractory response to VEN+AZA as shown by our previous studies. In all graphs, teal colored symbols represent p-LSCs and their progenies, pink colored symbols represent m-LSCs and their progenies, circular arrows represent self-renewal capacity.

References

    1. Kreso A, Dick JE. Evolution of the cancer stem cell model. Cell stem cell. 2014;14(3):275–91. - PubMed
    1. Pollyea DA, Jordan CT. Therapeutic targeting of acute myeloid leukemia stem cells. Blood. 2017;129(12):1627–35. - PubMed
    1. Thomas D, Majeti R. Biology and relevance of human acute myeloid leukemia stem cells. Blood. 2017;129(12):1577–85. - PMC - PubMed
    1. Bonnet D, Dick JE. Human acute myeloid leukemia is organized as a hierarchy that originates from a primitive hematopoietic cell. Nature medicine. 1997;3(7):730–7. - PubMed
    1. Hope KJ, Jin L, Dick JE. Acute myeloid leukemia originates from a hierarchy of leukemic stem cell classes that differ in self-renewal capacity. Nat Immunol. 2004;5(7):738–43. - PubMed

Publication types

MeSH terms