Case Reports
. 2023 Aug 24;8(4):e0014223.
doi: 10.1128/msphere.00142-23. Epub 2023 Jun 26.

The role of pneumococcal extracellular vesicles on the pathophysiology of the kidney disease hemolytic uremic syndrome

Affiliations
Case Reports

The role of pneumococcal extracellular vesicles on the pathophysiology of the kidney disease hemolytic uremic syndrome

Miriana Battista et al. mSphere. .

Abstract

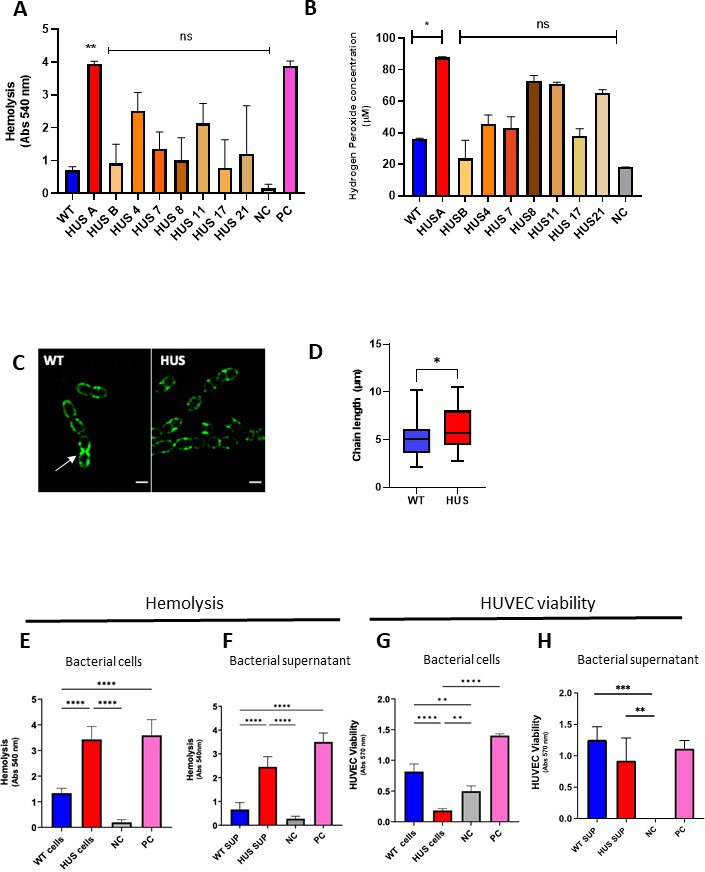
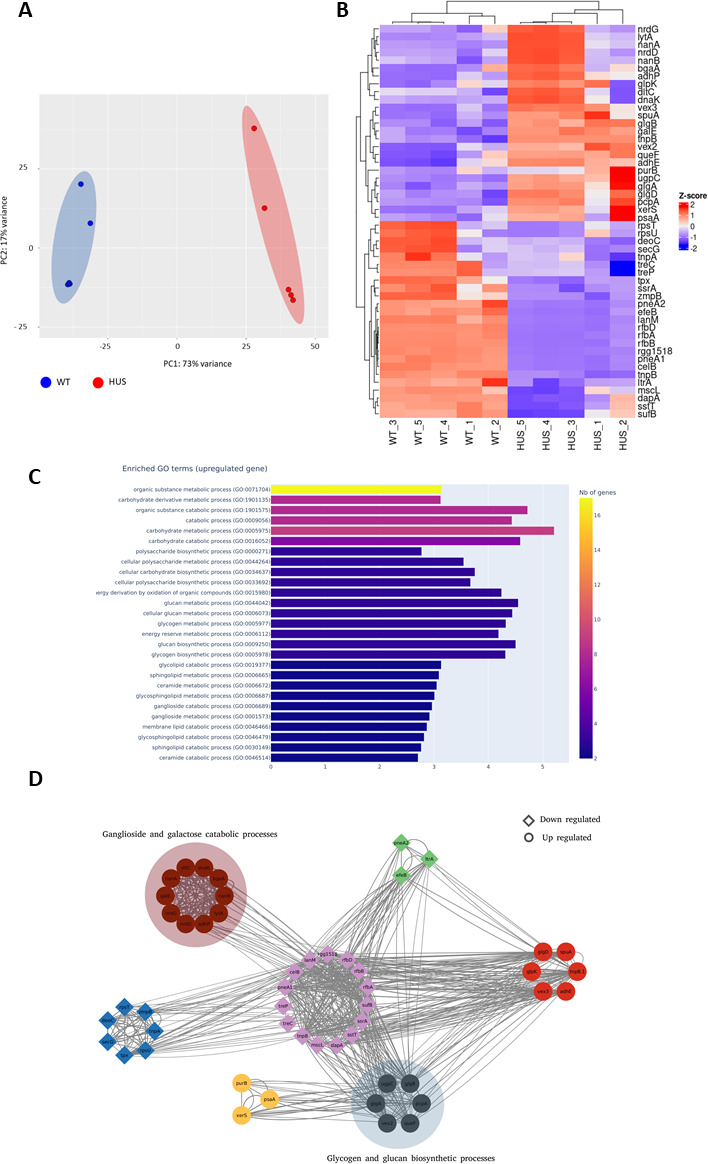
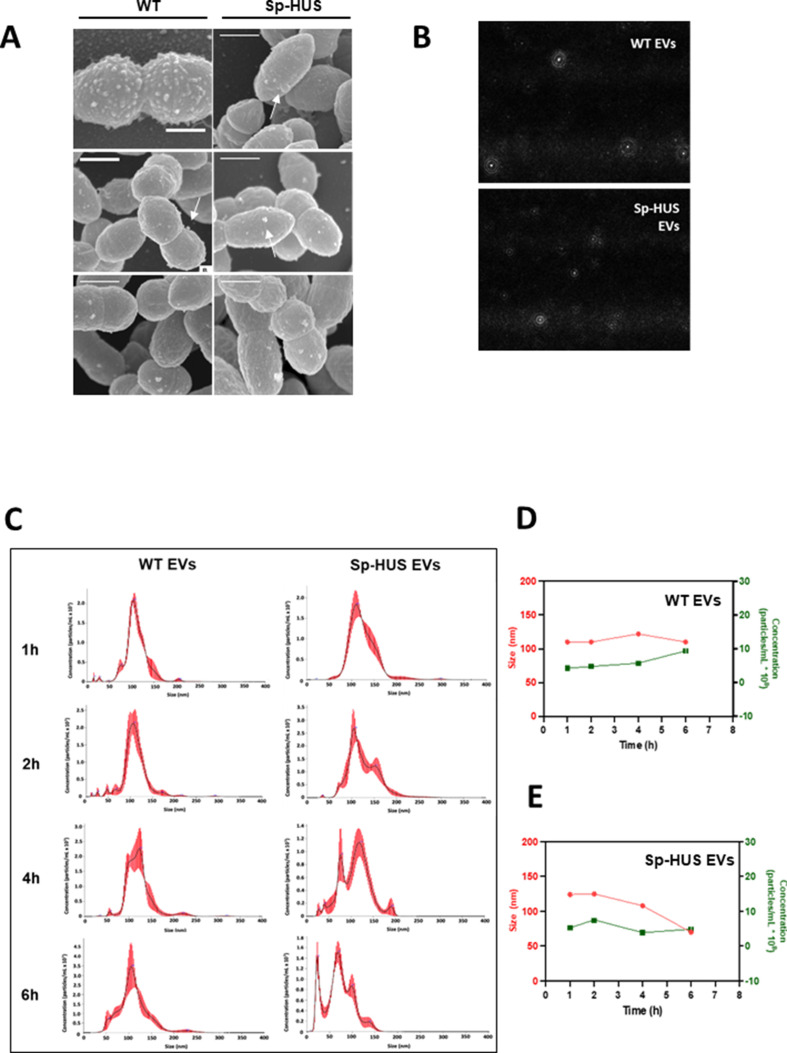
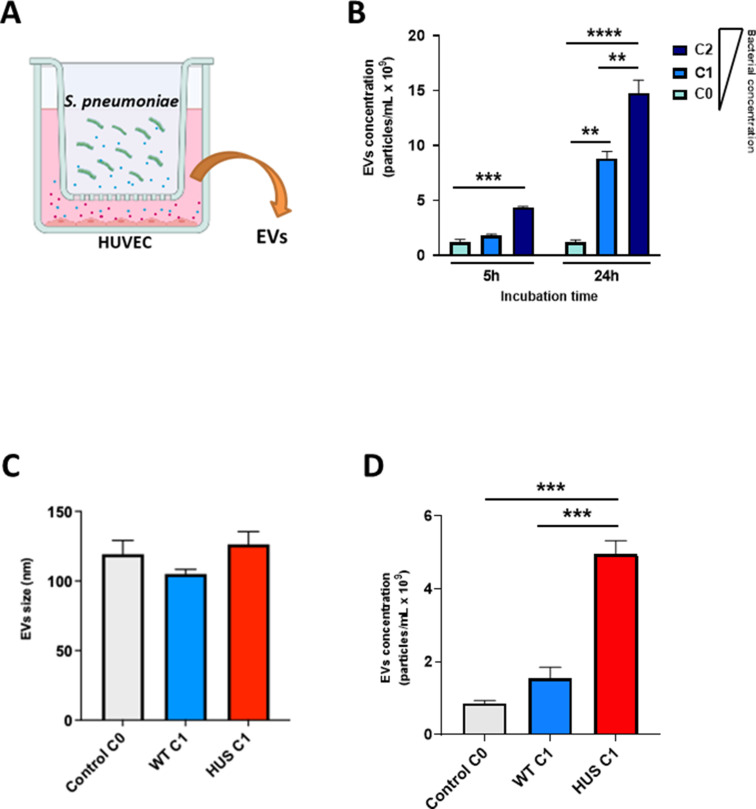
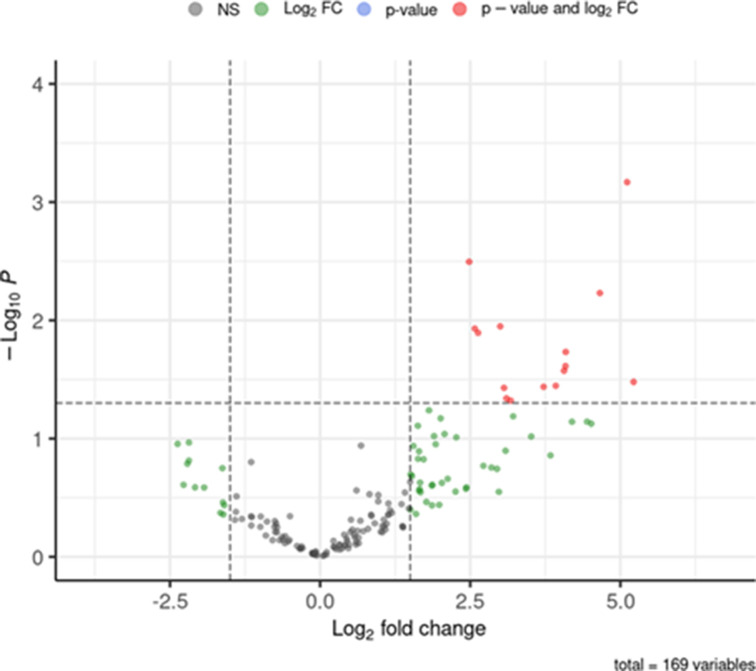
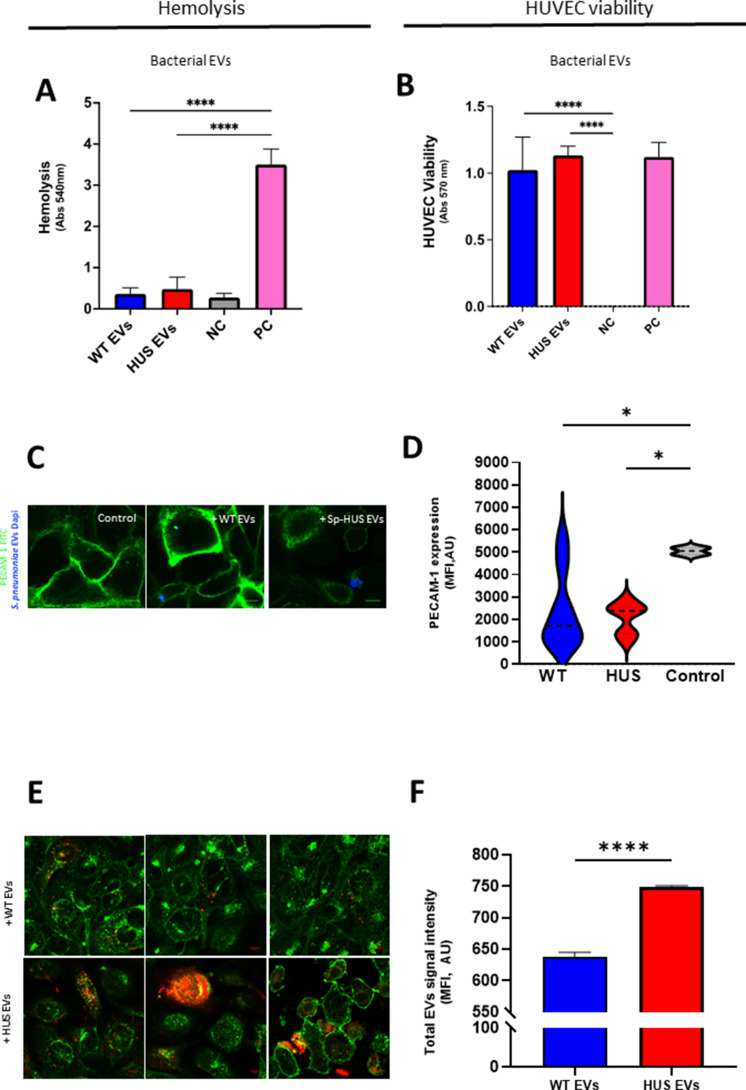
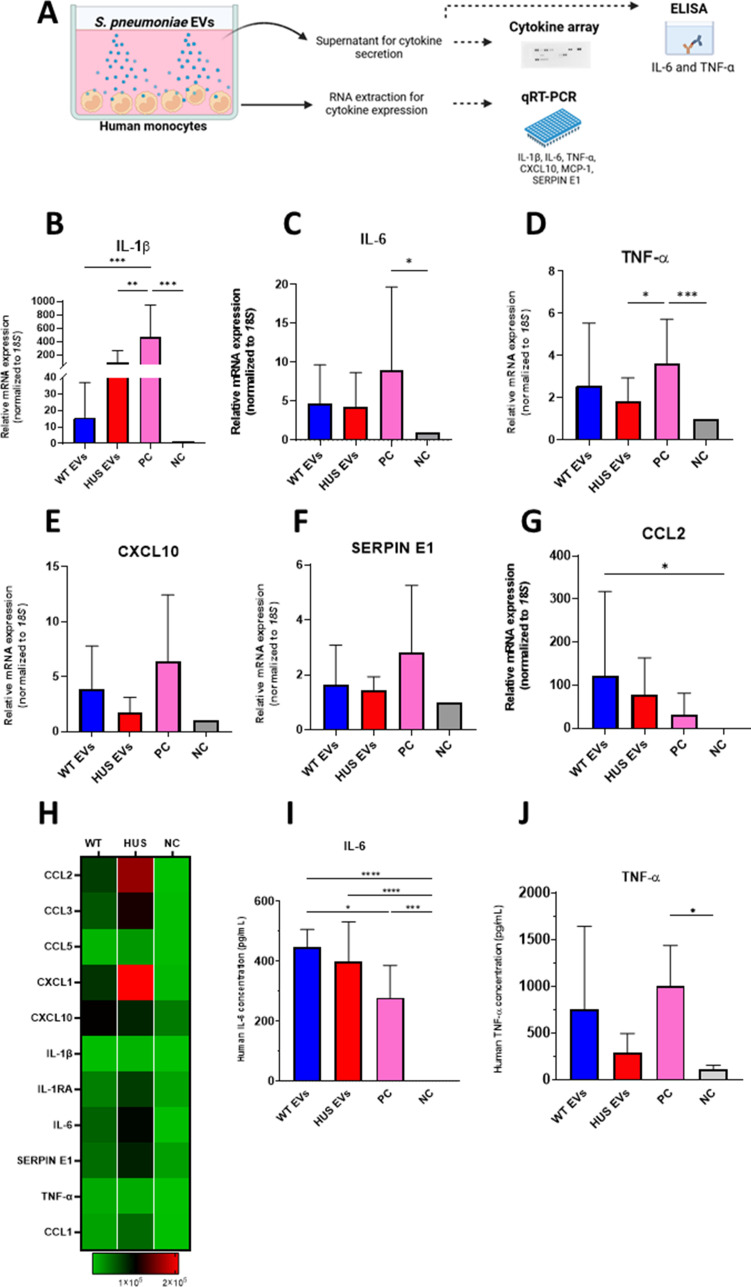
Streptococcus pneumoniae-induced hemolytic uremic syndrome (Sp-HUS) is a kidney disease characterized by microangiopathic hemolytic anemia, thrombocytopenia, and acute kidney injury. This disease is frequently underdiagnosed and its pathophysiology is poorly understood. In this work, we compared clinical strains, isolated from infant Sp-HUS patients, with a reference pathogenic strain D39, for host cytotoxicity and further explored the role of Sp-derived extracellular vesicles (EVs) in the pathogenesis of an HUS infection. In comparison with the wild-type strain, pneumococcal HUS strains caused significant lysis of human erythrocytes and increased the release of hydrogen peroxide. Isolated Sp-HUS EVs were characterized by performing dynamic light-scattering microscopy and proteomic analysis. Sp-HUS strain released EVs at a constant concentration during growth, yet the size of the EVs varied and several subpopulations emerged at later time points. The cargo of the Sp-HUS EVs included several virulence factors at high abundance, i.e., the ribosomal subunit assembly factor BipA, the pneumococcal surface protein A, the lytic enzyme LytC, several sugar utilization, and fatty acid synthesis proteins. Sp-HUS EVs strongly downregulated the expression of the endothelial surface marker platelet endothelial cell adhesion molecule-1 and were internalized by human endothelial cells. Sp-HUS EVs elicited the release of pro-inflammatory cytokines (interleukin [IL]-1β, IL-6) and chemokines (CCL2, CCL3, CXCL1) by human monocytes. These findings shed new light on the overall function of Sp-EVs, in the scope of infection-mediated HUS, and suggest new avenues of research for exploring the usefulness of Sp-EVs as therapeutic and diagnostic targets. IMPORTANCE Streptococcus pneumoniae-associated hemolytic uremic syndrome (Sp-HUS) is a serious and underdiagnosed deadly complication of invasive pneumococcal disease. Despite the introduction of the pneumococcal vaccine, cases of Sp-HUS continue to emerge, especially in children under the age of 2. While a lot has been studied regarding pneumococcal proteins and their role on Sp-HUS pathophysiology, little is known about the role of extracellular vesicles (EVs). In our work, we isolate and initially characterize EVs from a reference pathogenic strain (D39) and a strain isolated from a 2-year-old patient suffering from Sp-HUS. We demonstrate that despite lacking cytotoxicity toward human cells, Sp-HUS EVs are highly internalized by endothelial cells and can trigger cytokine and chemokine production in monocytes. In addition, this work specifically highlights the distinct morphological characteristics of Sp-HUS EVs and their unique cargo. Overall, this work sheds new light into potentially relevant players contained in EVs that might elucidate about pneumococcal EVs biogenesis or pose as interesting candidates for vaccine design.

Keywords: cytokines; extracellular vesicles; immunomodulation; microbe-host.


Conflict of interest statement

The authors declare no conflict of interest.

Figures

Fig 1
Fig 1
Sp-HUS strains and supernatant-mediated damage on human red blood cells and endothelia. Eight Sp-HUS strains (HUS A, B, 4, 7, 8, 11, 17, and 21) were assayed for their capacity to hemolyze human red blood cells (A). Red blood cells from three healthy donors were incubated with midexponentially grown bacterial cells at 37°C. PBS and bi-distilled water served as negative and positive controls, respectively. The absorbance of the supernatants was measured at 540 nm. Mean ± SD. (B) Released hydrogen peroxide was quantified on the supernatant of the same strains. Bacterial cultures were harvested at midexponential phase and centrifuged, and the supernatant immediately assayed for the presence of hydrogen peroxide using a commercial kit. Means are shown from biological triplicates. Mean ± SD. (C) Representative SR-SIM images of wild-type (WT) and Sp-HUS strains stained with WGA-488. Scale bar is 1 µm. (D) Quantification of pneumococcal strains chain length from SR-SIM images. Cellular (E) and supernatant fractions (F) of selected strains were tested separately for their hemolytic capacity. (G) HUVEC viability was evaluated after incubation with WT or Sp-HUS strains or the corresponding supernatant fractions (H) by CTB assay. Tert-butyl hydroperoxide (400 µM) and DMEM were used as negative (gray bar) and positive (pink bar) controls, respectively. (D–G) Means are shown from biological triplicates. Mean ± SD.
Fig 2
Fig 2
RNAseq analysis of pneumococcal strains. (A) PCA plot of bacterial transcriptome from RNAseq analysis. (B) Heatmap of differentially expressed genes from the RNAseq analysis of five replicates of WT and Sp-HUS bacteria highlighting upregulated (red) and downregulated (blue) genes in the Sp-HUS strain. (C) GO enrichment analysis. (D) Resulting network based on acquired experimental data. Circles represent upregulation and diamonds downregulation (see Supplementary file 1 for methods).
Fig 3
Fig 3
Characterization of pneumococcal EVs. (A) Representative SEM images of S. pneumoniae strains during shedding of EVs (arrows). Scale bar = 560 nm. (B) Representative snapshots of WT and Sp-HUS EVs, visualized by light-scattering microscopy. (C) Histograms of EVs concentration (particles/mL × 107) and size (nm), after nanoparticle tracking analysis. EVs were isolated from WT or Sp-HUS supernatant at different time points of growth (1, 2, 4, and 6 hours). (D and E) Sum-up graphs showing WT (D) and Sp-HUS (E) EVs size (nm) (red line) and concentration (particles/mL × 108) (green line) over time.
Fig 4
Fig 4
EV production result of the co-incubation of S. pneumoniae and endothelial cells. (A) Schematic representation (created with Biorender) of a Transwell system used to co-incubate pneumococci (green) and HUVECs (pink) to test vesicle production (blue and red dots). HUVECs were seeded on the bottom of the basolateral compartment, and S. pneumoniae strains were inoculated on the apical side of the inlet. The supernatant from the basolateral compartment (containing both S. pneumoniae and HUVEC-released EVs) was processed to isolate EVs. (B) Graph representing EV concentration (particles/mL × 109), after HUVEC incubation with WT strain, at two different bacterial concentrations (C1 = MOI 10, light blue bar, and C2 = MOI 20, dark blue bar) in the Transwell system for 5 or 24 hours at 37°C. A condition with HUVECs but no bacterial cells (C0, white bar) was used as control. (C) Graph showing average size (nm) of EVs isolated from the 24-hour co-incubation of HUVECs and WT (blue) or Sp-HUS strain (red) at one bacterial concentration (C1). A condition with HUVECs but no bacterial cells (C0, white bar) was used as negative control. (D) Graph representing EV concentration (particles/mL × 109) of the same co-incubation setup as in (C). Mean ± SD.
Fig 5
Fig 5
Proteomic analysis of pneumococcal EVs cargo. The proteome of Sp-HUS EVs fraction (n = 5) was compared with the proteome of WT EVs (n = 5). Fold changes in protein levels are represented as the log2 ratio of Sp-HUS EVs and WT EVs (log2 FC [log2 fold change]), while the significance of these changes is represented by the negative logarithm of the P-value of a t-test corrected for multiple comparisons (−log10 P-value). Significantly upregulated proteins of HUS EVs compared with WT EVs are shown in red.
Fig 6
Fig 6
Sp-HUS EVs host–cellular interactions. (A) The hemolytic activity of WT and Sp-HUS EVs was tested on human red blood cells, similarly to Fig. 1A. Means are shown from biological triplicates. Mean ± SD. (B) HUVEC viability was evaluated after incubation with WT or Sp-HUS EVs by CTB assay is a similar fashion as Fig. 1C. Means are shown from biological triplicates. Mean ± SD. (C) Representative confocal laser-scanning microscopy images of endothelial cells (FITC-labeled anti-PECAM-1 antibody, green) interaction with WT or Sp-HUS EVs (prestained with DAPI, blue). HUVECs in growth medium (DMEM) were taken as control. Scale bar = 10 μm. (D) Violin plots of the fluorescence intensity of PECAM-1 signal (green) expressed in arbitrary units (AU). (E) Representative CLSM images of WT and Sp-HUS EVs (prestained with DiD, red) internalization by endothelial cells (WGA CF 488A, green). Scale bar = 10 μm. (F) Fluorescence intensity of WT (blue bar) and Sp-HUS (red bar) EVs signal expressed in AU. Means are shown from biological triplicates. Mean ± SD.
Fig 7
Fig 7
Cytokine expression and production by human monocytes in response to pneumococcal EVs. (A) Schematic representation (created with Biorender)of experiments performed to analyze EV-induced cytokine expression and production by human monocytes. Monocytes from healthy donors were incubated with WT or Sp-HUS EVs. (B–G) Total RNA extracted from healthy human donor’s monocytes (n = 9) was used to assess transcriptional levels of IL-1β, IL-6, TNF-α, CXCL10, SERPIN E1, and CCl2 by qRT-PCR. (H) Supernatants of biological triplicates were used to detect cytokine production using a Proteome Profiler Human Cytokine Array. Heat map shows 11 cytokines deregulated in monocytes. (I and J) IL-6 and TNF-α production by monocytes quantified by ELISA. In all experiments, untreated monocytes and zymosan treatment (100 µg/mL) were considered the negative (gray bar) and positive (pink bar) controls, respectively. Means are shown from three healthy human donors. Mean ± SD.

Similar articles

Cited by

References

    1. Loirat C, Frémeaux-Bacchi V. 2011. Atypical hemolytic uremic syndrome. Orphanet J Rare Dis 6:60. doi:10.1186/1750-1172-6-60 - DOI - PMC - PubMed
    1. Joseph C, Gattineni J. 2013. Complement disorders and hemolytic uremic syndrome. Curr Opin Pediatr 25:209–215. doi:10.1097/MOP.0b013e32835df48a - DOI - PMC - PubMed
    1. Zipfel PF, Lauer N. 2013. Defective complement action and control defines disease pathology for retinal and renal disorders and provides a basis for new therapeutic approaches. Adv Exp Med Biol 735:173–187. doi:10.1007/978-1-4614-4118-2_11 - DOI - PubMed
    1. Meinel C, Spartà G, Dahse H-M, Hörhold F, König R, Westermann M, Coldewey SM, Cseresnyés Z, Figge MT, Hammerschmidt S, Skerka C, Zipfel PF. 2018. Streptococcus pneumoniae from patients with hemolytic uremic syndrome binds human plasminogen via the surface protein PspC and uses plasmin to damage human endothelial cells. J Infect Dis 217:358–370. doi:10.1093/infdis/jix305 - DOI - PubMed
    1. Agarwal HS, Latifi SQ. 2021. Streptococcus pneumoniae-associated hemolytic uremic syndrome in the era of pneumococcal vaccine. Pathogens 10:727. doi:10.3390/pathogens10060727 - DOI - PMC - PubMed

Publication types

LinkOut - more resources