. 2023 Aug 17;11(4):e0093723.
doi: 10.1128/spectrum.00937-23. Epub 2023 Jun 26.

Bacterial Swarm-Mediated Phage Transportation Disrupts a Biofilm Inherently Protected from Phage Penetration

Affiliations

Bacterial Swarm-Mediated Phage Transportation Disrupts a Biofilm Inherently Protected from Phage Penetration

Nichith K Ratheesh et al. Microbiol Spectr. .

Abstract

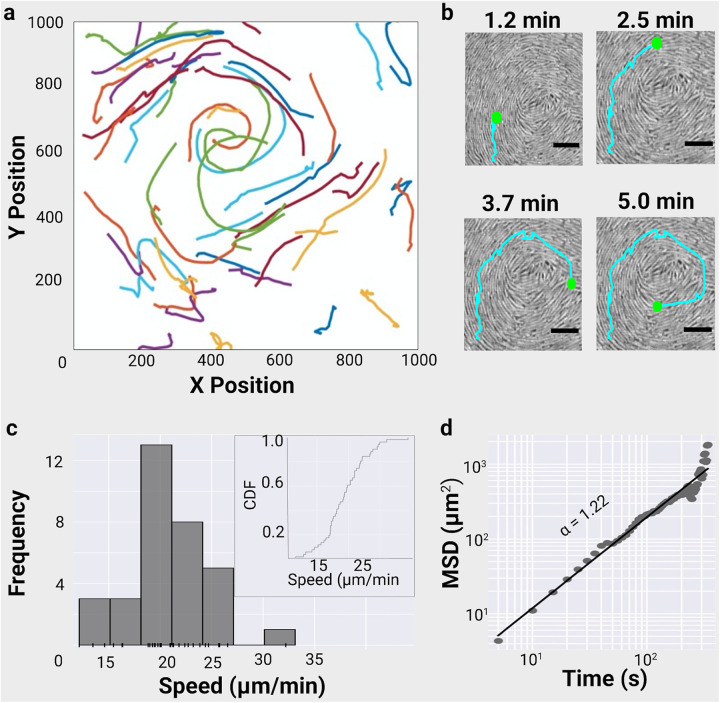
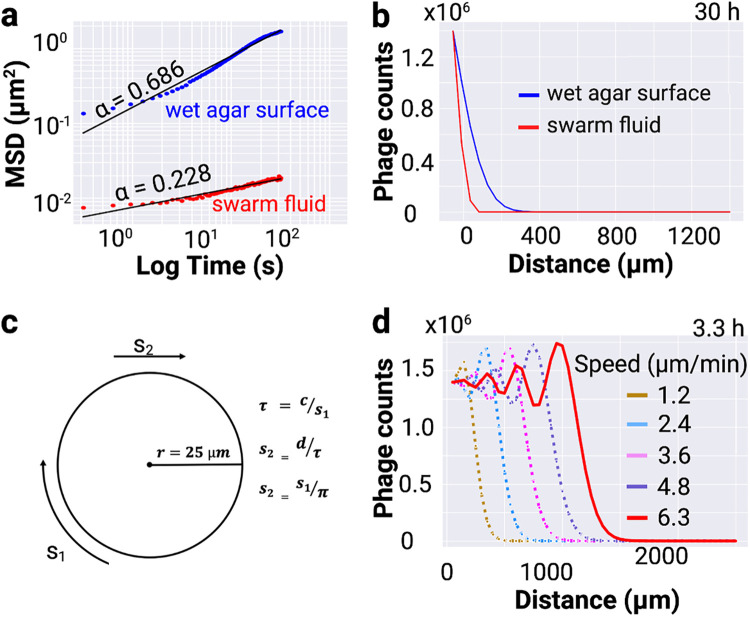
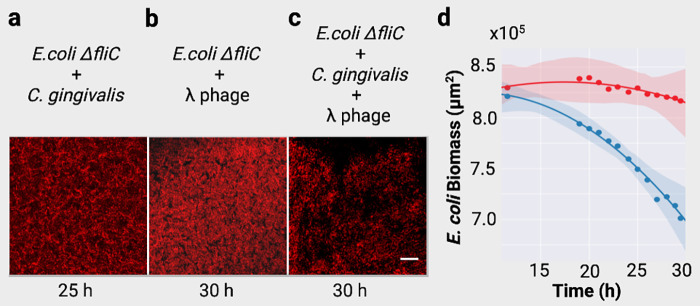
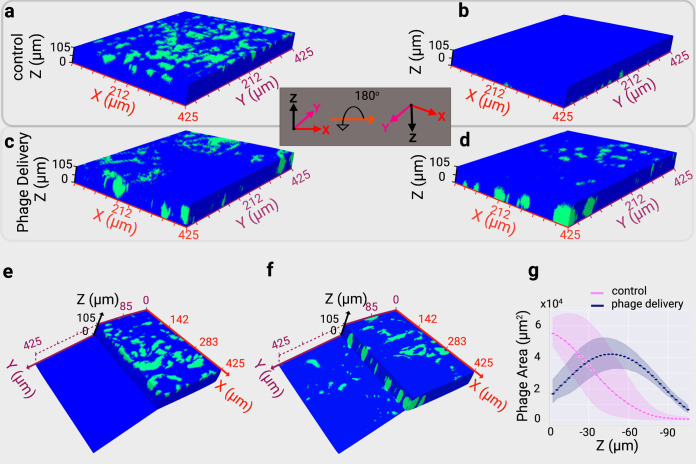
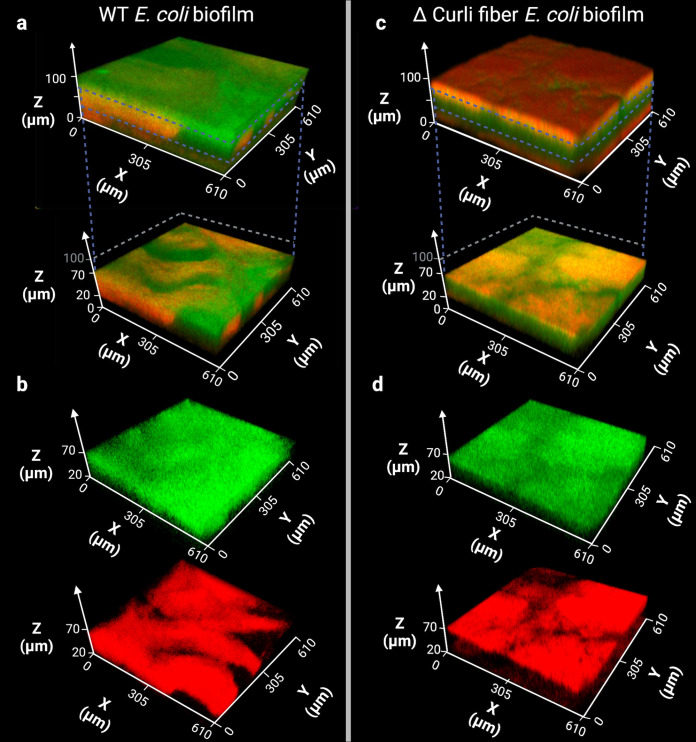
Physical forces that arise due to bacterial motility and growth play a significant role in shaping the biogeography of the human oral microbiota. Bacteria of the genus Capnocytophaga are abundant in the human oral microbiota and yet very little is known about their physiology. The human oral isolate Capnocytophaga gingivalis exhibits robust gilding motility that is driven by the rotary type 9 secretion system (T9SS), and cells of C. gingivalis transport nonmotile oral microbes as cargo. Phages, i.e., viruses that infect bacteria, are found in abundance within the microbiota. By tracking fluorescently labeled lambda phages that do not infect C. gingivalis, we report active phage transportation by C. gingivalis swarms. Lambda phage-carrying C. gingivalis swarms were propagated near an Escherichia coli colony. The rate of disruption of the E. coli colony increased 10 times compared with a control where phages simply diffused to the E. coli colony. This finding suggests a mechanism where fluid flows produced by motile bacteria increase the rate of transport of phages to their host bacterium. Additionally, C. gingivalis swarms formed tunnel-like structures within a curli fiber-containing E. coli biofilm that increased the efficiency of phage penetration. Our data suggest that invasion by a C. gingivalis swarm changes the spatial structure of the prey biofilm and further increases the penetration of phages. IMPORTANCE Dysbiosis of the human oral microbiota is associated with several diseases, but the factors that shape the biogeography of the oral microbiota are mostly opaque. Biofilms that form in the human supragingival and subgingival regions have a diverse microbial community where some microbes form well-defined polymicrobial structures. C. gingivalis, a bacterium abundant in human gingival regions, has robust gliding motility that is powered by the type 9 secretion system. We demonstrate that swarms of C. gingivalis can transport phages through a complex biofilm which increases the death rate of the prey biofilm. These findings suggest that C. gingivalis could be used as a vehicle for the transportation of antimicrobials and that active phage transportation could shape the spatial structure of a microbial community.

Keywords: active transport; bacterial motility; biofilm; collective motion; gliding motility; oral microbiome; phage; swarming; type 9 secretion system.


Conflict of interest statement

The authors declare no conflict of interest.

Figures

FIG 1
FIG 1
A swarm of C. gingivalis actively transports phages. (a) Trajectories from Movie S1 show 33 phages being propelled by a C. gingivalis swarm. (b) Time-lapse images of a cropped section of Movie S1 showing a fluorescent lambda phage being transported by a swarm of C. gingivalis (gray). The positions of a phage and the trajectory are shown in green and cyan, respectively. Scale bar = 5 μm. (c) A frequency distribution and a rug plot of phage speed. Inset shows the cumulative density function (CDF) of phage speed. (d) Ensemble mean squared displacement of phages from Movie S1 plotted as a function of time. The slope (α = 1.22) of the power-law fit implies that the phages are super diffusive and are actively propelled by a C. gingivalis swarm.
FIG 2
FIG 2
Prediction of the distance travelled by transported phages. (a) Mean squared displacement of phages diffusing in a thin layer of liquid on a wet agar surface (blue) and swarm fluid of bacteria with inhibited motility (red). (b) A prediction of one-dimensional distance covered by phages diffusing in the two fluids described above. (c) A cartoon outlining a vortexing swarm with radius r, circumference c, and vortexing speed s1. Using the three equations shown in the inset, linear speed s2 is calculated to be 6.3 μm/min. (d) A prediction of one-dimensional distance covered by actively transported phages. Outputs for linear speed ranging from 1.2 μm/min to 6.3 μm/min are shown.
FIG 3
FIG 3
Phage delivery reduces the biomass of the prey. Images of the red fluorescent E. coli colony shown at the end of the timelapses for the control and experimental settings. These images accompany Movie S6 to S8 and Fig. S4 to S8. (a) The control where swarming C. gingivalis were inoculated at a distance of 1 mm from the periphery of an E. coli inoculum shows minimal temporal reduction in the biomass of the red fluorescent E. coli colony. (b) The control where λ phage was inoculated at a distance of 1 mm from the periphery of the E. coli inoculum demonstrates minimal temporal reduction in the biomass of the E. coli colony. (c) The experimental condition where a mixture of λ phage and C. gingivalis was inoculated at a distance of 1 mm from the periphery of an E. coli inoculum shows a significant temporal reduction of E. coli biomass. (d) Changes in the area of E. coli biomass depicted as a function of time. Dots represent the mean of three biological replicates. The red data points indicate changes in fluorescence from the timelapse captured for b, and the blue shows changes in fluorescence from the timelapse captured in c. Dark lines are second order regression fits, and the light-shaded regions represent the 95% confidence interval.
FIG 4
FIG 4
Transportation by C. gingivalis increases the three-dimensional phage delivery within a mature E. coli biofilm. Phages are in green, and blue depicts the E. coli biofilm. (a) Top view of the control E. coli biofilm with only λ phage added. (b) Bottom view of the same biofilm. These images are taken from Movie S9. (c) Top view of the experimental E. coli biofilm with the addition of λ phage and unlabeled C. gingivalis. (d) Bottom view of the same biofilm. These images are taken from Movie S10. (e) A slice of the biofilm from a and b, allowing a partial view of the top and bottom layer for the control. (f) A slice of the biofilm allowing a partial view of the top and bottom layer of the biofilm from c and d for the experimental setting. (g) The location of phages along the z-axis show that after delivery by C. gingivalis, phages are found in all regions within the biofilm, with maximum area coverage present at a depth of ~50 μm. Whereas the location of naturally diffusing λ phages in the control is clustered primarily within the top regions. Connected dots represent the mean from three biological replicates. The light-shaded regions represent the 95% confidence interval.
FIG 5
FIG 5
Fluorescence in situ hybridization of C. gingivalis swarms on E. coli biofilms. (a) A 3D rendering of curli fiber-containing E. coli biofilms grown and spotted with C. gingivalis swarms. Green fluorescence indicates C. gingivalis, stained with a fluorescently labeled 16S rRNA probe targeting Capnocytophaga sp., and red fluorescence indicates mCherry-tagged E. coli. (Top) Shows the entire 105-μm-deep biofilm, covered by a layer of C. gingivalis, which was segmented in the second row to display the inner sections of the biofilm between 20 and 70 μm. In this region of the biofilm, E. coli cells were displaced by what appear to be C. gingivalis tunnels. (b) The individual channels of the segmented biofilm shown in a. (c) In the absence of curli fibers, C. gingivalis no longer forms a layer on top of the biofilm and instead penetrates into the middle layers of the biofilm. (d). Individual channels of the segmented biofilm shown in c.

Similar articles

Cited by

References

    1. Salmond GPC, Fineran PC. 2015. A century of the phage: past, present and future. Nat Rev Microbiol 13:777–786. doi:10.1038/nrmicro3564. - DOI - PubMed
    1. Hansen MF, Svenningsen SL, Røder HL, Middelboe M, Burmølle M. 2019. Big impact of the tiny: bacteriophage–bacteria interactions in biofilms. Trends Microbiol 27:739–752. doi:10.1016/j.tim.2019.04.006. - DOI - PubMed
    1. Vidakovic L, Singh PK, Hartmann R, Nadell CD, Drescher K. 2018. Dynamic biofilm architecture confers individual and collective mechanisms of viral protection. Nat Microbiol 3:26–31. doi:10.1038/s41564-017-0050-1. - DOI - PMC - PubMed
    1. Berg HC. 1993. Random Walks in Biology. Princeton University Press, New Jersey, USA. https://press.princeton.edu/books/paperback/9780691000640/random-walks-i.... Retrieved 15 June 2021.
    1. Cauda V, Onida B, Platschek B, Mühlstein L, Bein T. 2008. Large antibiotic molecule diffusion in confined mesoporous silica with controlled morphology. J Mater Chem 18:5888–5899. doi:10.1039/b805395b. - DOI

Publication types

LinkOut - more resources