. 2023 Jul 27;97(7):e0066423.
doi: 10.1128/jvi.00664-23. Epub 2023 Jun 26.

Reduced NR2F2 Expression in the Host Response to Infectious Bursal Disease Virus Infection Suppressed Viral Replication by Enhancing Type I Interferon Expression by Targeting SOCS5

Affiliations

Reduced NR2F2 Expression in the Host Response to Infectious Bursal Disease Virus Infection Suppressed Viral Replication by Enhancing Type I Interferon Expression by Targeting SOCS5

Guangju You et al. J Virol. .

Abstract

Nuclear receptors are ligand-activated transcription factors that play an important role in regulating innate antiviral immunity and other biological processes. However, the role of nuclear receptors in the host response to infectious bursal disease virus (IBDV) infection remains elusive. In this study, we show that IBDV infection or poly(I·C) treatment of DF-1 or HD11 cells markedly decreased nuclear receptor subfamily 2 group F member 2 (NR2F2) expression. Surprisingly, knockdown, knockout, or inhibition of NR2F2 expression in host cells remarkably inhibited IBDV replication and promoted IBDV/poly(I·C)-induced type I interferon and interferon-stimulated genes expression. Furthermore, our data show that NR2F2 negatively regulates the antiviral innate immune response by promoting the suppressor of cytokine signaling 5 (SOCS5) expression. Thus, reduced NR2F2 expression in the host response to IBDV infection inhibited viral replication by enhancing the expression of type I interferon by targeting SOCS5. These findings reveal that NR2F2 plays a crucial role in antiviral innate immunity, furthering our understanding of the mechanism underlying the host response to viral infection. IMPORTANCE Infectious bursal disease (IBD) is an immunosuppressive disease causing considerable economic losses to the poultry industry worldwide. Nuclear receptors play an important role in regulating innate antiviral immunity. However, the role of nuclear receptors in the host response to IBD virus (IBDV) infection remains elusive. Here, we report that NR2F2 expression decreased in IBDV-infected cells, which consequently reduced SOCS5 expression, promoted type I interferon expression, and suppressed IBDV infection. Thus, NR2F2 serves as a negative factor in the host response to IBDV infection by regulating SOCS5 expression, and intervention in the NR2F2-mediated host response by specific inhibitors might be employed as a strategy for prevention and treatment of IBD.

Keywords: IBDV; NR2F2; SOCS5; type I interferon.


Conflict of interest statement

The authors declare no conflict of interest.

Figures
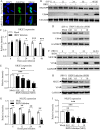
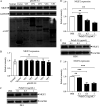
FIG 1
FIG 1
NR2F2 expression was reduced in cells with IBDV infection. (A) Examination of the localization of NR2F2 by laser confocal scanning microscopy. DF-1 cells were seeded on 24-well plates with coverslips in the wells and cultured overnight. Cells were transfected with pRK5-Flag-NR2F2 or empty vector as a control. Twenty-four hours after transfection, the cells were fixed, permeabilized, and probed with mouse anti-Flag antibodies, followed by incubation with FITC-conjugated goat anti-mouse IgG antibodies (green). Cell nuclei were counterstained with DAPI (blue). Cells were observed with a laser confocal scanning microscope. Bar = 10 μm. (B to E) IBDV infection reduced NR2F2 expression in DF-1 cells. DF-1 cells were mock infected or infected with IBDV at an MOI of 1. At different time points (6, 12, 24, 36, and 48 h) after IBDV infection, cell lysates were prepared and examined by Western blotting using anti-NR2F2, anti-VP4, and anti-tubulin antibodies (B). Endogenous tubulin expression was used as an internal control. The band intensities for NR2F2 in panel B were quantitated by densitometry (C). The relative levels of NR2F2 were calculated as the ratio of the band density of NR2F2 to that of tubulin. DF-1 cells were mock infected or infected with IBDV at MOI of 0.01, 0.1, 1, and 10. Twenty-four hours after infection, cell lysates were prepared and examined by Western blotting using anti-NR2F2, anti-VP4, and anti-GAPDH antibodies (D). Endogenous GAPDH expression was used as an internal control. The band intensities for NR2F2 in panel D were quantitated by densitometry (E). The relative levels of NR2F2 were calculated as the ratio of the band density of NR2F2 to that of GAPDH. (F to I) The expression of NR2F2 decreased in HD11 cells with IBDV infection. HD11 cells were mock infected or infected with IBDV at an MOI of 1. At the indicated time points after IBDV infection, cell lysates were prepared and examined by Western blotting using anti-NR2F2, anti-VP4, and anti-GAPDH antibodies (F). Endogenous GAPDH expression was used as an internal control. The band intensities for NR2F2 in panel F were quantitated by densitometry (G). HD11 cells were mock infected or infected with IBDV at MOI of 0.01, 0.1, 1, and 10. Twenty-four hours after infection, cell lysates were prepared and examined by Western blotting using anti-NR2F2, anti-VP4, and anti-GAPDH antibodies (H). Endogenous GAPDH expression was used as an internal control. The band intensities for NR2F2 in panel H were quantitated by densitometry (I). The relative levels of NR2F2 were calculated as the ratio of the band density of NR2F2 to that of GAPDH. Data are representative of three independent experiments and are means and SD. ***, P < 0.001; **, P < 0.01; *, P < 0.05.
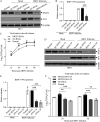
FIG 2
FIG 2
Effect of IBDV viral proteins and dsRNA on NR2F2 expression in cells. (A and B) IBDV viral proteins did not affect NR2F2 expression in host cells. DF-1 cells were transfected with pEGFP-N1, pEGFP-VP1, pEGFP-VP2, pEGFP-VP3, pEGFP-VP4, or pEGFP-VP5. Twenty-four hours posttransfection, cell lysates were prepared and examined by Western blotting using anti-NR2F2, anti-GFP, and anti-GAPDH antibodies. Endogenous GAPDH expression was used as an internal control. The band intensities for NR2F2 in panel A were quantitated by densitometry (B). The relative levels of NR2F2 were calculated as the band density of NR2F2/that of GAPDH. (C and D) The expression of NR2F2 decreased in DF-1 cells with poly(I·C) treatment. DF-1 cells were transfected with 0.1, 0.5, or 1 μg/mL of poly(I·C) or medium. Twenty-four hours after transfection, cell lysates were prepared and examined by Western blotting using anti-NR2F2 and anti-GAPDH antibodies. Endogenous GAPDH expression was used as an internal control. The band intensities for NR2F2 in panel C were quantitated by densitometry (D). (E and F) NR2F2 expression was reduced in HD11 cells with poly(I·C) treatment. HD11 cells were transfected with 0.1, 0.5, or 1 μg/mL of poly(I·C) or medium. Twenty-four hours after transfection, cell lysates were prepared and examined by Western blotting using anti-NR2F2 and anti-GAPDH antibodies. Endogenous GAPDH expression was used as an internal control. The band intensities for NR2F2 in panel E were quantitated by densitometry (F). Data are representative of three independent experiments and are means and SD. ***, P < 0.001; **, P < 0.01; ns, not significant (P > 0.05).
FIG 3
FIG 3
Knockdown of NR2F2 by RNAi suppressed IBDV replication. (A and B) Knockdown of NR2F2 by RNAi in DF-1 cells reduced IBDV VP4 expression. DF-1 cells were double transfected with NR2F2 siRNA 2# or RNAi controls at a 24-h interval. Twenty-four hours after the second transfection, cells were infected with IBDV at an MOI of 0.1. Twenty-four hours after infection, cell lysates were prepared and examined by Western blotting using anti-NR2F2, anti-VP4, and anti-GAPDH antibodies (A). Endogenous GAPDH expression was used as an internal control. The band intensities for VP4 in panel A were quantitated by densitometry (B). The relative levels of VP4 were calculated as the band density of VP4/that of GAPDH. (C) Knockdown of NR2F2 by RNAi in DF-1 cells suppressed IBDV growth. DF-1 cells were treated as described for panel A. At the indicated time points (12, 24, 36, and 48 h) after IBDV infection, the viral loads in the cell cultures were determined by TCID50 assays. (D and E) Knockdown of NR2F2 by RNAi in HD11 cells reduced IBDV VP4 expression. HD11 cells were transfected with NR2F2 siRNA 1#, siRNA 2#, or RNAi controls. Twenty-four hours after transfection, cells were infected with IBDV at an MOI of 1. Twenty-four hours after infection, cell lysates were prepared and examined by Western blotting using anti-NR2F2, anti-VP4, and anti-GAPDH antibodies (D). Endogenous GAPDH expression was used as an internal control. The band intensities for VP4 in panel D were quantitated by densitometry (E). (F) Knockdown of NR2F2 by RNAi in HD11 cells suppressed IBDV replication. HD11 cells were transfected with NR2F2 siRNA 1#, siRNA 2#, or RNAi controls. Twenty-four hours after transfection, cells were infected with IBDV at an MOI of 0.1. At 24 and 36 h after IBDV infection, the viral loads in the cell cultures were determined by TCID50 assays. Data are representative of three independent experiments and are means and SD. ***, P < 0.001; **, P < 0.01; *, P < 0.05.
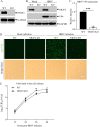
FIG 4
FIG 4
NR2F2 deficiency suppressed IBDV replication. (A) Examination of NR2F2 expression in NR2F2 knockout DF-1 cell line by Western blotting. (B and C) Knockout of NR2F2 in DF-1 cells reduced IBDV VP4 expression. WT and NR2F2-KO DF-1 cells were infected with IBDV at an MOI of 0.1. Twenty-four hours after infection, cell lysates were prepared and examined by Western blotting using anti-NR2F2, anti-VP4, and anti-GAPDH antibodies. Endogenous GAPDH expression was used as an internal control. The band intensities for VP4 in panel B were quantitated by densitometry (C). The relative levels of VP4 were calculated as the ratio of the band density of VP4 to that of GAPDH. (D) Examination of IBDV replication in WT and NR2F2-KO DF-1 cells by IFA. WT and NR2F2-KO DF-1 cells were infected with IBDV at an MOI of 0.1. Twenty-four hours after infection, cells were fixed and examined for IBDV VP4 protein by immunofluorescence assays. The pictures in the upper panels were taken under a fluorescence microscope, and those in the lower panels were taken under a light microscope. Bar = 100 μm. (E) IBDV replication was suppressed in NR2F2-KO DF-1 cells. WT and NR2F2-KO DF-1 cells were infected with IBDV at an MOI of 0.01. At different time points (12, 24, 36, and 48 h) postinfection, the viral loads in the cell cultures were determined by TCID50 assays. Data are representative of three independent experiments and are means and SD. ***, P < 0.001; **, P < 0.01; *, P < 0.05.
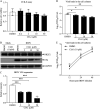
FIG 5
FIG 5
Inhibition of NR2F2 by the specific inhibitor CIA1 suppressed IBDV replication. (A) Examination of DF-1 cell viability by CCK-8 assay after incubation with the NR2F2 inhibitor CIA1 for 24 h. (B and C) CIA1 treatment reduced IBDV VP4 expression. DF-1 cells were mock infected or infected with IBDV at an MOI of 0.1. Two hours after infection, cells were treated with CIA1 at different doses (2, 10, and 50 μM) or DMSO control. Twenty-four hours after infection, cell lysates were prepared and examined by Western blotting using anti-NR2F2, anti-VP4, and anti-GAPDH antibodies (B). Endogenous GAPDH expression was used as an internal control. The band intensities for VP4 in panel B were quantitated by densitometry (C). The relative levels of VP4 were calculated as the band density of VP4/that of GAPDH. (D and E) CIA1 treatment suppressed IBDV growth. DF-1 cells were treated as described for panel B, and the viral loads in the cell cultures were determined by TCID50 assays (D). At the indicated time points (12, 24, and 48 h) after IBDV infection, the viral loads in the cell cultures were determined by TCID50 assays (E). Data are representative of three independent experiments and are means and SD. ***, P < 0.001; **, P < 0.01; *, P < 0.05.
FIG 6
FIG 6
Knockdown of NR2F2 by RNAi in DF-1 cells increased IBDV/poly(I·C)-induced expression of type I interferon and interferon-stimulated genes. DF-1 cells were transfected with NR2F2 siRNA 1# or RNAi controls. Thirty-six hours after transfection, cell lysates were prepared and examined by Western blotting using anti-NR2F2 and anti-GAPDH antibodies (A). Twenty-four hours after transfection, cells were infected with IBDV at an MOI of 1 or treated with poly(I·C) at a final concentration of 0.4 μg/mL. Twelve hours after IBDV infection or poly(I·C) treatment, the mRNA expression of IFN-α (B), IFN-β (C), IRF7 (D), NF-κB p65 (E), MX1 (F), IFIT5 (G), and IFI6 (H) was measured by qRT-PCR using specific primers. The mRNA expression of GAPDH was used as an internal control. Data are representative of three independent experiments and are means and SD. ***, P < 0.001; **, P < 0.01; *, P < 0.05.
FIG 7
FIG 7
NR2F2 deficiency in DF-1 cells enhanced IBDV/poly(I·C)-induced expression of type I interferon and interferon-stimulated genes. WT and NR2F2-KO DF-1 cells were infected with IBDV at an MOI of 1 or treated with poly(I·C) at a final concentration of 0.4 μg/mL. Twelve hours after IBDV infection or poly(I·C) treatment, the mRNA expression of IFN-α (A), IFN-β (B), IRF7 (C), NF-κB p65 (D), MX1 (E), PKR (F), IFIT5 (G), and IFI6 (H) was measured by qRT-PCR. The mRNA expression of GAPDH was used as an internal control. Data are representative of three independent experiments and are means and SD. ***, P < 0.001; **, P < 0.01; *, P < 0.05.
FIG 8
FIG 8
NR2F2 deficiency in HD11 cells enhanced IBDV-induced expression of type I interferon and interferon-stimulated genes. (A) Examination of NR2F2 expression in the NR2F2 knockout HD11 cell line by Western blotting. (B to I) The expression of type I interferon and ISGs was enhanced in NR2F2-KO HD11 cells with IBDV infection. WT and NR2F2-KO HD11 cells were infected with IBDV at an MOI of 5. Six and 12 h after infection, the mRNA expression of IFN-α (B), IFN-β (C), IRF7 (D), NF-κB p65 (E), MX1 (F), PKR (G), IFIT5 (H), and IFI6 (I) was measured by qRT-PCR. The mRNA expression of GAPDH was used as an internal control. Data are representative of three independent experiments and are means and SD. ***, P < 0.001; **, P < 0.01; *, P < 0.05.
FIG 9
FIG 9
NR2F2 enhanced SOCS5 expression by binding to its promoter. (A) Schematic diagram of pGL3-SOCS5-Luc-WT and mutant plasmids. (B) Overexpression of NR2F2 induced activation of SOCS5 promoter. DF-1 cells were transfected with pRK5-Flag-NR2F2 or empty vector (pRK5-Flag) as a control together with the indicated reporter plasmids (pGL3-SOCS5-Luc-WT or mutant plasmids). pRL-TK plasmid was added to each transfection as a control. Twenty-four hours after transfection, cells were lysed, and a luciferase reporter gene assay was performed to measure SOCS5 promoter activity. (C to E) Examination of the binding of NR2F2 to the SOCS5 promoter by ChIP analysis. Schematic diagram of the ChIP assay of SOCS5 promoter segments (C). NR2F2-KO DF-1 cells were transfected with pRK5-Flag-NR2F2 or empty vector (pRK5-Flag) as a control. Twenty-four hours after transfection, cells were cross-linked and subjected to a ChIP assay using ChIP kits. The enrichment of SOCS5 promoter segments was analyzed by PCR (D) or qPCR (E) assays using specific primers. (F) Effect of NR2F2 deficiency on SOCS5 mRNA expression. WT and NR2F2-KO DF-1 cells were mock infected or infected with IBDV at an MOI of 1. Twelve hours after infection, the mRNA expression of SOCS5 was measured by qRT-PCR using specific primers. The mRNA expression of GAPDH was used as an internal control. (G and H) Effect of NR2F2 deficiency on SOCS5 expression. WT and NR2F2-KO DF-1 cells were mock infected or infected with IBDV at an MOI of 0.1. Twenty-four hours after infection, cell lysates were prepared and examined by Western blotting using anti-SOCS5, anti-NR2F2, anti-VP4, and anti-GAPDH antibodies (G). Endogenous GAPDH expression was used as an internal control. The band intensities for SOCS5 in panel G were quantitated by densitometry (H). The relative levels of SOCS5 were calculated as the ratio of the band density of SOCS5 to that of GAPDH. Data are representative of three independent experiments and are means and SD. ***, P < 0.001; **, P < 0.01; *, P < 0.05.
FIG 10
FIG 10
The antiviral effect of NR2F2 deficiency in host cells could be blocked by SOCS5 overexpression. (A to C) Transfection of NR2F2-KO DF-1 cells with pRK5-Flag-SOCS5 blocked NR2F2 deficiency-mediated suppression of IBDV replication. WT and NR2F2-KO DF-1 cells were transfected with pRK5-Flag or pRK5-Flag-SOCS5. Twenty-four hours after transfection, cells were infected with IBDV at an MOI of 0.1. Twenty-four hours after infection, cell lysates were prepared and examined by Western blotting using anti-Flag, anti-NR2F2, anti-VP4, and anti-GAPDH antibodies (A). Endogenous GAPDH expression was used as an internal control. The band intensities for VP4 in panel A were quantitated by densitometry (B). The relative levels of VP4 were calculated as the ratio of the band density of VP4 to that of GAPDH. The viral loads in the cell cultures were determined by TCID50 assays (C). (D to G) SOCS5 overexpression blocked NR2F2 deficiency-mediated enhancement of poly(I·C)-induced expression of type I interferon and interferon-stimulated genes. WT and NR2F2-KO DF-1 cells were transfected with pRK5-Flag or pRK5-Flag-SOCS5. Twenty-four hours after transfection, cells were treated with poly(I·C) at a final concentration of 0.2 μg/mL. Twelve hours after treatment, the mRNA expression of IFN-α (D), IFN-β (E), MX1 (F), and IFI6 (G) was measured by qRT-PCR using specific primers. The mRNA expression of GAPDH was used as an internal control. Data are representative of three independent experiments and are means and SD. ***, P < 0.001; **, P < 0.01; *, P < 0.05; ns, not significant (P > 0.05).
FIG 11
FIG 11
Model for the role of NR2F2 in the host response to IBDV infection. Recognition of IBDV dsRNA in the cytosol of host cells by the pattern recognition receptor MDA5 inhibits NR2F2 expression. As a consequence, the reduced expression of NR2F2 in IBDV-infected cells resulted in decreased SOCS5 expression, thereby enhancing type I interferon expression and suppressing IBDV replication.

Similar articles

Cited by

References

    1. Jackwood DJ. 2017. Advances in vaccine research against economically important viral diseases of food animals: infectious bursal disease virus. Vet Microbiol 206:121–125. doi:10.1016/j.vetmic.2016.11.022. - DOI - PubMed
    1. Withers DR, Young JR, Davison TF. 2005. Infectious bursal disease virus-induced immunosuppression in the chick is associated with the presence of undifferentiated follicles in the recovering bursa. Viral Immunol 18:127–137. doi:10.1089/vim.2005.18.127. - DOI - PubMed
    1. Rodriguez-Lecompte JC, Nino-Fong R, Lopez A, Frederick Markham RJ, Kibenge FS. 2005. Infectious bursal disease virus (IBDV) induces apoptosis in chicken B cells. Comp Immunol Microbiol Infect Dis 28:321–337. doi:10.1016/j.cimid.2005.08.004. - DOI - PubMed
    1. Fan L, Wu T, Wang Y, Hussain A, Jiang N, Gao L, Li K, Gao Y, Liu C, Cui H, Pan Q, Zhang Y, Wang X, Qi X. 2020. Novel variants of infectious bursal disease virus can severely damage the bursa of fabricius of immunized chickens. Vet Microbiol 240:108507. doi:10.1016/j.vetmic.2019.108507. - DOI - PubMed
    1. Mahgoub HA, Bailey M, Kaiser P. 2012. An overview of infectious bursal disease. Arch Virol 157:2047–2057. doi:10.1007/s00705-012-1377-9. - DOI - PubMed

Publication types