. 2023 Jun 26;13(3):4879-4907.
doi: 10.1002/cphy.c220027.

Exercise and Experiments of Nature

Affiliations

Exercise and Experiments of Nature

Michael J Joyner et al. Compr Physiol. .

Abstract

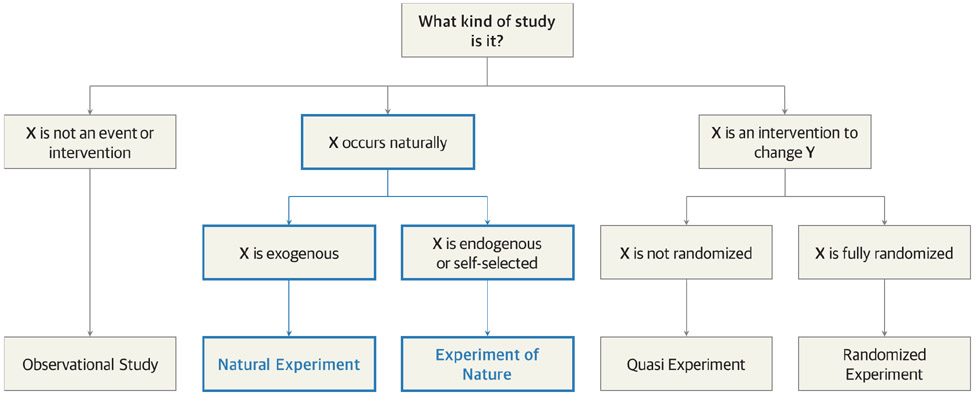
In this article, we highlight the contributions of passive experiments that address important exercise-related questions in integrative physiology and medicine. Passive experiments differ from active experiments in that passive experiments involve limited or no active intervention to generate observations and test hypotheses. Experiments of nature and natural experiments are two types of passive experiments. Experiments of nature include research participants with rare genetic or acquired conditions that facilitate exploration of specific physiological mechanisms. In this way, experiments of nature are parallel to classical "knockout" animal models among human research participants. Natural experiments are gleaned from data sets that allow population-based questions to be addressed. An advantage of both types of passive experiments is that more extreme and/or prolonged exposures to physiological and behavioral stimuli are possible in humans. In this article, we discuss a number of key passive experiments that have generated foundational medical knowledge or mechanistic physiological insights related to exercise. Both natural experiments and experiments of nature will be essential to generate and test hypotheses about the limits of human adaptability to stressors like exercise. © 2023 American Physiological Society. Compr Physiol 13:4879-4907, 2023.


Figures

Figure 1.
Figure 1.. Conceptualization of passive experiments within wider evaluation framework.
A conceptual model displaying different types of experiment based on allocation of an intervention (null, natural, or experimental) and assignment to an intervention (randomized or not). Although randomized experiments are generally considered to be least susceptible to bias, passive experiments (both natural experiments and experiments of nature) enable the evaluation of changes to a system that are difficult or implausible to manipulate experimentally. Adapted from de Vocht et al (86) and Remler and Van Ryzin (294).
Figure 2.
Figure 2.. Physiological responses during progressive incremental exercise for control participants and participants with McArdle’s disease.
Line charts displaying the increase in blood lactate (A) and minute ventilation (V.E; B) and change in arterial blood pH (C) during progressive incremental exercise until volitional exhaustion. The progressive incremental exercise test included four minutes of light exercise at a workload corresponding to 30% maximal aerobic capacity (V.O2max) on a bicycle ergometer followed by regular increases in workload every minute designed to elicit an approximate 10% increase in V.O2 until a pedal frequency of 50-60 revolutions per minute could no longer be maintained. Twenty-six control participants (red lines and circles) and four participants with McArdle disease (blue lines and triangles) are represented. Symbols represent group means and the error bars represent standard error. Adapted from Hagberg et al 1982 (142).
Figure 3.
Figure 3.. Total incidence of coronary heart disease and associated clinical presentations among male civil servants in the United Kingdom.
Vertical bar charts displaying the total incidence coronary heart- disease and associated clinical presentations among about 31,000 male civil servants aged 35 to about 60 years employed by the London Transport Executive (A) and the Civil Service (B). In this natural experiment conducted in 1949 to 1950, all ill-health related occupational absences and retirements and the associated medical causes were recorded, and medical causes assigned to any code associated with coronary heart disease (code numbers 420 to 434) underwent detailed scrutiny. Civil servants included in these observations were homogenous for demographic and health backgrounds and were subsequently exposed to highly divergent levels of occupational physical activity. Among the civil servants observed in this natural experiment, red vertical bars represent employees who primarily sat during occupational activities (bus drivers [A] and telephonists [B]) and blue vertical bars represent employees who systematically walked during occupational activities (bus conductors [A] and postmen [B]). The groups of employees with high levels of occupational physical activity (bus conductors and postmen) had lower incidence of coronary heart disease and greater incidence of angina pectoris compared to groups of employees with low levels of occupational physical activity (bus drivers and telephonists). Adapted from Morris et al 1953 (252).
Figure 4.
Figure 4.. Negative association between cardiorespiratory fitness and risk of all-cause mortality.
Vertical bar charts displaying a graded decrease in risk of all-cause mortality with increasing cardiorespiratory fitness groups 30 years of age and older, stratified by 10-year age group and categorical cardiorespiratory fitness level (A). Line and scatter plot displaying a reduction in risk of all-cause mortality with higher cardiorespiratory fitness (expressed in metabolic equivalent units [METs]; B). Cardiorespiratory fitness was estimated using a maximal treadmill stress test following the standardized Bruce protocol (43) in about 70,000 people who underwent physician-referred stress testing in hospitals affiliated with Henry Ford Health System as part of the Henry Ford Exercise Testing Project (3). These figures represent a group of about 38,000 adults (about 14,000 women) free of known cardiovascular disease with high cardiorespiratory fitness levels (≥ 10 METs) were followed for 11.5 years on average for all-cause mortality. Adapted from Feldman et al 2015 (111).
Figure 5.
Figure 5.. Extremely large coronary arteries in a lifelong endurance exerciser.
Diagrammatic representation of the left main coronary artery 0.5 cm from the ostium from an autopsy study of a lifelong champion runner (Clarence “Mr. Marathon” DeMar; A) and a “control” patient who died at a similar age (B). A lifetime of endurance exercise training was associated with a very large coronary artery lumen diameter in DeMar. Redrawn from photographs in Currens and White (80). Created with BioRender.com.
Figure 6.
Figure 6.. Association between occupational physical activity and both body weight and daily caloric intake.
Line charts displaying the reduction in body weight (blue circles and line) and “U-shaped” relationship in daily caloric intake (red triangles and line) with greater occupational physical activity among 213 employees of a jute processing plant in West Bengal, India. In this natural experiment conducted in the 1950s, food intake was assessed via dietary interviews, weight was measured using portable scales, and occupational physical activity was stratified into broad activity-based categories using both oxygen consumption and surveys to assess physical demand associated with occupation. Categories of occupational physical activity listed from least to most activity included: sedentary work (stallholders, supervisors, and clerks I), light work (clerks II, clerks III, clerks IV, and mechanics), medium work (drivers, winders, weavers, and bagging twisters), heavy work (millwaste carriers, pilers, and selectors), and very heavy work (ashmen, coalmen, blacksmiths, cutters, and carriers). Adapted from Mayer et al (231).
Figure 7.
Figure 7.. Null association between body mass index (BMI) of active and sedentary monozygotic twins.
The scatter plot displays the BMI of 10 pairs of female twins (red triangles) and 25 pairs of male twins (blue circles). The monozygotic twins were identified using data from the National Runners’ Health Study (372, 373), and the active twin is defined as running more weekly miles than the sedentary twin by at least 25 weekly miles for males and 20 weekly miles for females. The black line represents the line of equality and a hypothetical line depicting identical BMI values between pairs of twins. Adapted from Williams et al 2005 (374).
Figure 8.
Figure 8.. Divergent physiological adaptations among a pair of male monozygotic twins with 30 years of discordant exercise habits.
Vertical bar charts displaying differences in maximal aerobic capacity (V.O2max; A), body fat (B), and myosin heavy chain (MHC) isoform composition of vastus lateralis muscle fibers (C & D) between two 52-year-old male monozygotic twins. The trained twin (blue bars) regularly engaged in various modes of endurance exercise including running ~40,000 miles from July 1993 to June 2015. Conversely, the untrained twin (red bars) refrained from regular exercise other than normal activities of daily living. V.O2max was estimated using a maximal graded cycling exercise test with an open-circuit indirect calorimeter. The trained twin initiated the test with a workload of 125 W and the workload was increased 25 W each minute until volitional task failure, and the untrained twin initiated the test with a workload of 110 W and the workload was increased 15 to 25 W each minute until volitional task failure (A). Body composition was assessed with dual energy x-ray absorptiometry (B). A muscle biopsy from the vastus lateralis was obtained using the standard Bergström technique (16, 254), and muscle fiber composition was classified by myosin heavy chain protein (MHC) isoform using both single fibers and homogenized samples via standard SDS-PAGE methods (C & D). Adapted from Bathgate et al (23).
Figure 9.
Figure 9.. Age-related decline in maximal aerobic capacity (V.O2max) among a large, representative cohort, nine octogenarian lifelong athletes, and six healthy untrained octogenarians.
Plots displaying the decline in V.O2max across the human lifespan among men, including normative values (yellow area fill) from about 45,000 healthy men from the Cooper Institute in Dallas, Texas (5) and data from Trappe and colleagues (351) representing nine octogenarian lifelong athletes (blue circles) and six healthy untrained octogenarians (red triangles). The dashed line represents the prognostic exercise capacity (5 metabolic equivalents (METs) or 17.5 mL·kg−1·min−1) associated with both a loss of independent lifestyle and increased risk of mortality, as described by Myers and colleagues (257). Adapted from Trappe et al 2013 (351).
Figure 10.
Figure 10.. Age-related decline in maximal aerobic capacity (V.O2max) among both untrained and trained men.
Scatter and line plots displaying the decline in V.O2max across the human lifespan from an amalgam of studies (8, 13, 27, 30, 42, 84, 88, 89, 139, 242, 289, 299, 300). In these experiments of nature, maximal aerobic capacity (V.O2max) was estimated using standardized, graded, maximal stress testing among champion male athletes with very high levels of physical activity and sedentary men with no formal training across the lifespan. Four sets of data from Heath and colleagues are represented, displaying the decline in V.O2max between 16 highly trained male Masters endurance athletes (blue circles), 16 well-trained young athletes (blue square), nine lean and moderately active middle-aged men (orange circle), and nine overweight and inactive middle-aged men (light blue circle). Lines representing the estimated decline in V.O2max among leaner and/or moderately active untrained men (orange line) and overweight and/or physically inactive men (light blue line) from Heath and colleagues are plotted based on two assumptions: (i) V.O2max declines at a rate of 9% per decade beginning at 25 years of age, and (ii) average V.O2max was 46 mL·kg−1·min−1 for untrained group A and 40 mL·kg−1·min−1 at 25 years of age. The line representing the estimated decrease in V.O2max among trained men (red line) is plotted based on a presumed decline in V.O2max of 9% per decade and a value of 70 mL·kg−1min·−1 at 25 years of age. Data from nine studies including 563 untrained men across the lifespan is represented as blue triangles. Data associated with 16 highly trained young male endurance athletes from Dill and colleagues is represented as red square. Data associated with well-trained middle-aged and older runners from both Grimby and colleagues and Pollock and colleagues are represented as red circles. Adapted from Heath et al 1981 (155).
Figure 11.
Figure 11.. Reduction in maximal aerobic capacity (V.O2max) associated with three weeks of bed rest.
Vertical bar charts displaying the reduction in V.O2max associated with three weeks of bed rest among five 20-year-old men. After retraining in 1966 V.O2max returned to baseline. Of note, the reduction in V.O2max after three weeks of bed rest was similar the reduction in V.O2max after 30 or 40 years of aging. V.O2max was estimated using a graded, maximal stress test following a standardized protocol— the test was initiated with a two-minute interval of exercise with a workload of 60 W and the workload was increased 30 W every two minutes until volitional task failure. Line and scatter plots represent data from individual participants. Adapted from McGavock et al (235).
Figure 12.
Figure 12.. Association of maximal aerobic capacity (V.O2max) and human aging.
Three linear regression lines and corresponding scatter plots displaying the decline in V.O2max across the human lifespan from three longitudinal studies—Asmussen et al [red line and symbols; (11)], Robinson et al [blue line and symbols; (301)], and Dill et al [orange line and symbols; (79, 258)].The solid portion of each regression line represents data as collected, and the dashed portion of each regression line represents a theoretical association extracted from each linear regression to its intercept on the x-axis. Data from Asmussen and colleagues represents 23 men who had their V.O2max measured twice, the first between ages 21 and 27 years and the second between ages 41 and 61 years. Data from Robinson and colleagues represents three men who had their V.O2max measured three times at ages 18 to 19 years, 40 to 43 years, and 50 to 51 years. Data from Dill and colleagues represents 12 V.O2max measurements of D.B. Dill over a 56-year period. Linear regression equations of best fit and associated Pearson correlation coefficients were y = 69.37 - 0.6315x, r = 0.57 (Asmussen et al); y = 67.19 - 0.6458x, r = 0.83 (Robinson et al); and y = 65.28 – 0.519x, r = 0.96 (Dill et al). Adapted from Booth FW 1989 (35).
Figure 13.
Figure 13.. Absent blood pressure raising reflex emanating from leg muscles during volitional exercise in a participant with a spinal cord lesion.
Line charts displaying the changes in arterial blood pressure associated with about five minutes of volitional exercise with concurrent occlusion of leg blood flow using suprasystolic sphygmomanometer cuff around the proximal thigh in a participant with a unilateral spinal cord lesion. The spinal cord lesion was associated with unilateral sensory loss on the right leg (insensitive leg; blue line) with no loss of sensation in the left leg (control leg; red line) and normal muscle power in both lower limbs. Adapted from Alam and Smirk 1938 (4).
Figure 14.
Figure 14.. Paradoxical reduction in blood pressure during supine exercise in a participant who had undergone sympathectomy to treat hypertension.
Line chart displaying the paradoxical reduction in arterial blood pressure associated with two minutes of supine cycling exercise which, in a separate experimental exercise, was not attenuated by a 15-degree head down tilt designed to facilitate cardiac filling. These data represent a 44-year-old man who had undergone thoracolumbar sympathectomy for essential hypertension. Blood pressure was recorded from the radial artery using a Statham strain-gage transducer. Adapted from Marshall et al (230).
Figure 15.
Figure 15.. Absent reduction in maximal aerobic capacity (V.O2max) during hypoxic exercise (relative to normoxic exercise) among people with high affinity hemoglobin variants.
The reduction in V.O2max during hypoxic exercise (fraction of inspired oxygen = 0.15) compared to normoxic exercise (fraction of inspired oxygen = 0.21) displayed as line and scatter plots (A) and vertical bar charts (B) among 11 people with high affinity hemoglobin variants (HAH; blue triangles) and 14 controls with normal affinity hemoglobin (red circles). V.O2max was estimated using a stepwise maximal graded exercise test on a bicycle ergometer. Adapted from Dominelli et al (92).
Figure 16.
Figure 16.. Association between hemoglobin oxygen affinity and hemoglobin concentration.
Linear correlation line and corresponding scatterplot displaying the negative association between a metric of hemoglobin oxygen affinity (P50) and hemoglobin concentration in humans. Data represent 50 people with high affinity hemoglobin variants (blue triangles), six controls with normal affinity hemoglobin (red circles), and 11 people with low affinity hemoglobin variants. Because females have hemoglobin concentration values of 1 to 2 g·dL−1 lower than males, hemoglobin concentrations were increased by 10% among females to obtain comparable data. Symbols with white outline represent females and symbols with black outline represent males. Adapted from Shepherd et al (328).

Similar articles

Cited by

References

    1. Adams GR, and Bamman MM. Characterization and regulation of mechanical loading-induced compensatory muscle hypertrophy. Compr Physiol 2: 2829–2870, 2012. - PubMed
    1. Aizer A, Gaziano JM, Cook NR, Manson JE, Buring JE, and Albert CM. Relation of vigorous exercise to risk of atrial fibrillation. Am J Cardiol 103: 1572–1577, 2009. - PMC - PubMed
    1. Al-Mallah MH, Keteyian SJ, Brawner CA, Whelton S, and Blaha MJ. Rationale and design of the Henry Ford Exercise Testing Project (the FIT project). Clin Cardiol 37: 456–461, 2014. - PMC - PubMed
    1. Alam M, and Smirk F. Unilateral loss of a blood pressure raising, pulse accelerating, reflex from voluntary muscle due to a lesion of the spinal cord. Clin Sci 3: 247–252, 1938.
    1. American College of Sports Medicine. ACSM's Exercise Testing and Prescription. Wolters Kluwer Health, 2017.

Publication types