. 2023 Oct;149(13):11263-11278.
doi: 10.1007/s00432-023-04989-4. Epub 2023 Jun 26.

Construction of HBV-HCC prognostic model and immune characteristics based on potential genes mining through protein interaction networks

Affiliations

Construction of HBV-HCC prognostic model and immune characteristics based on potential genes mining through protein interaction networks

Qingxiu Li et al. J Cancer Res Clin Oncol. 2023 Oct.

Abstract

Objective: To search for human protein-coding genes related to hepatocellular carcinoma (HCC) in the context of hepatitis B virus (HBV) infection, and perform prognosis risk assessment.

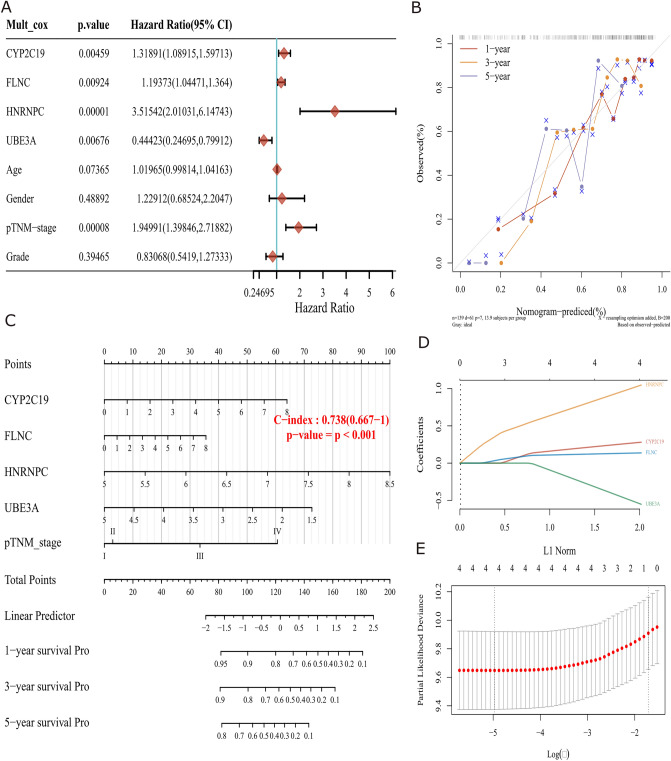
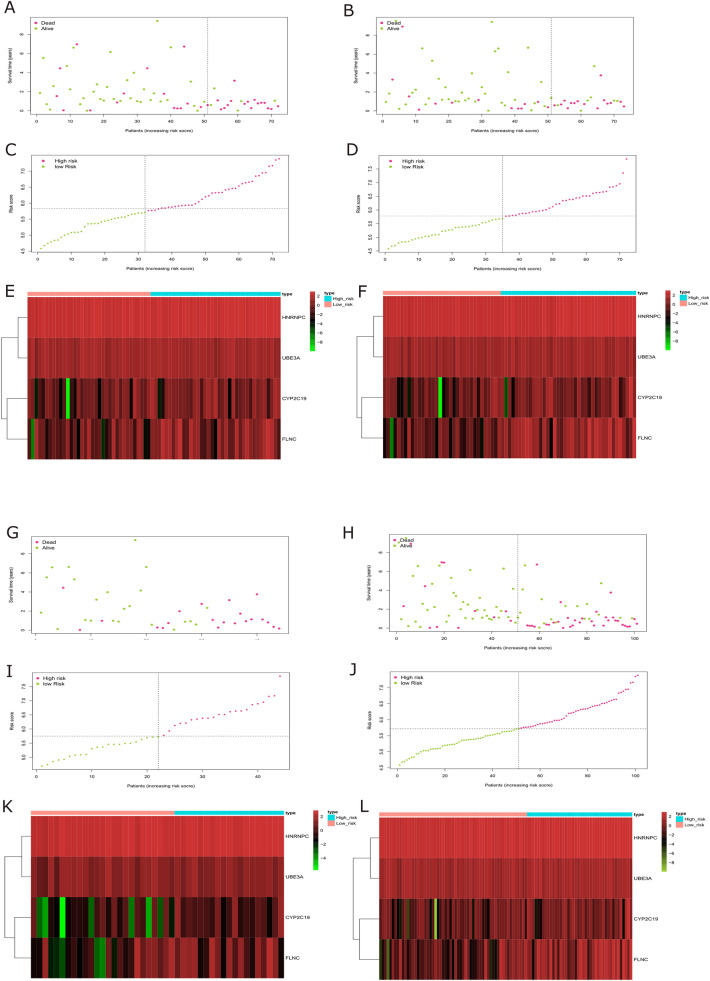
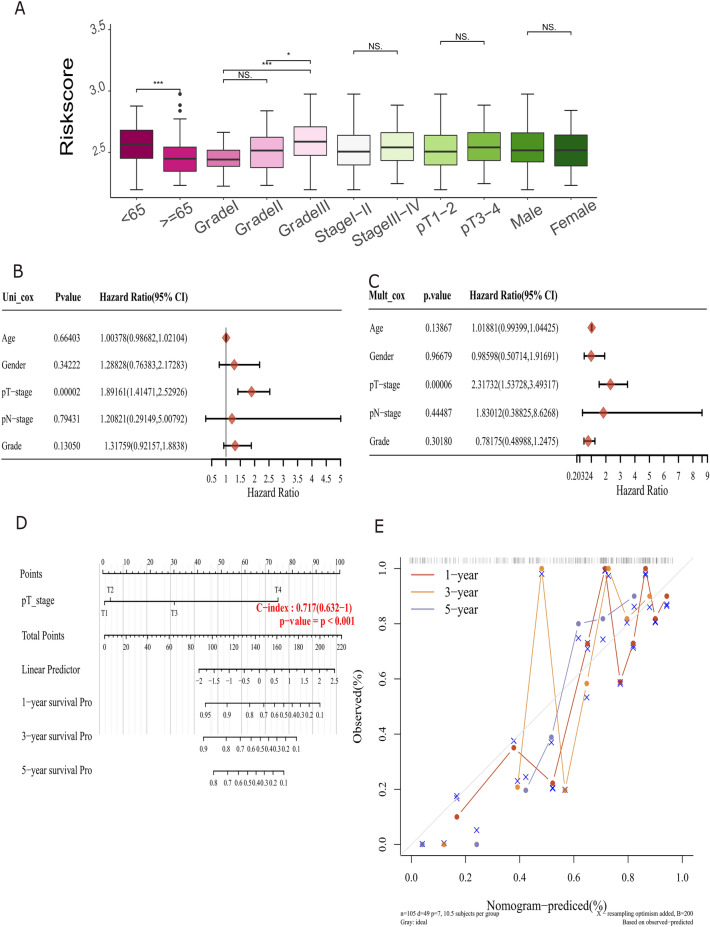
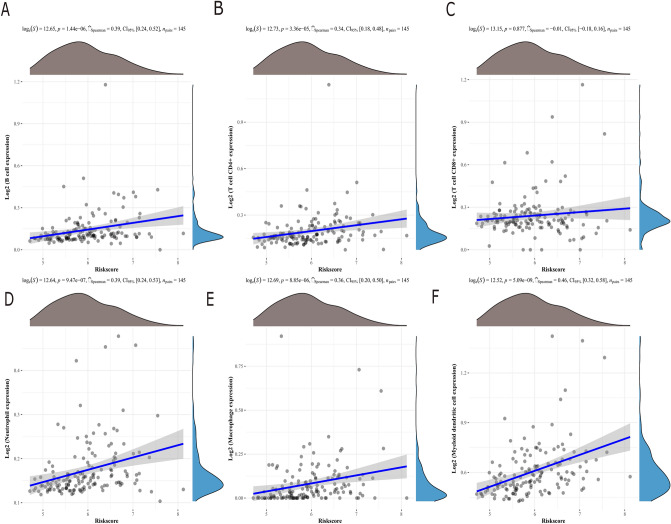
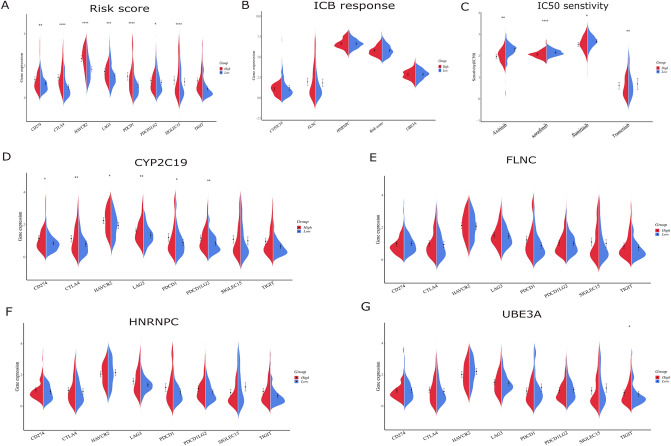
Methods: Genes related to HBV-HCC were selected through literature screening and protein-protein interaction (PPI) network database analysis. Prognosis potential genes (PPGs) were identified using Cox regression analysis. Patients were divided into high-risk and low-risk groups based on PPGs, and risk scores were calculated. Kaplan-Meier plots were used to analyze overall survival rates, and the results were predicted based on clinicopathological variables. Association analysis was also conducted with immune infiltration, immune therapy, and drug sensitivity. Experimental verification of the expression of PPGs was done in patient liver cancer tissue and normal liver tissue adjacent to tumors.

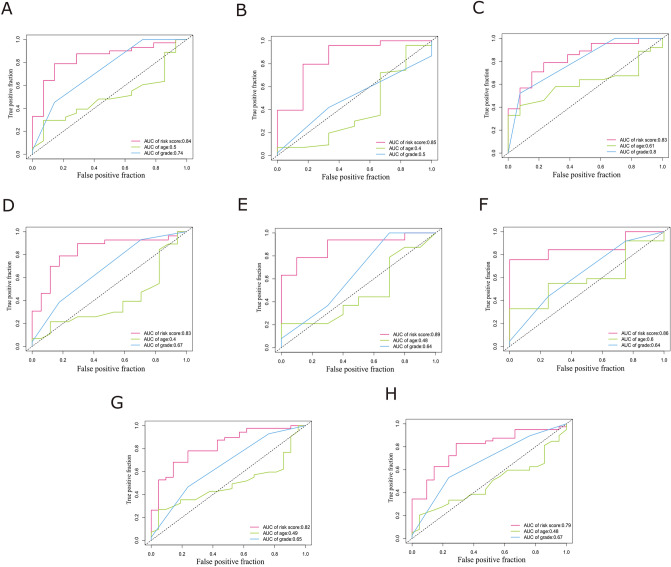
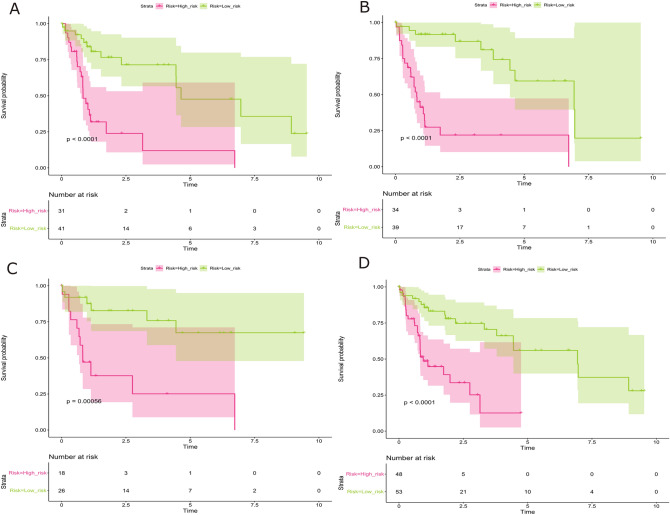
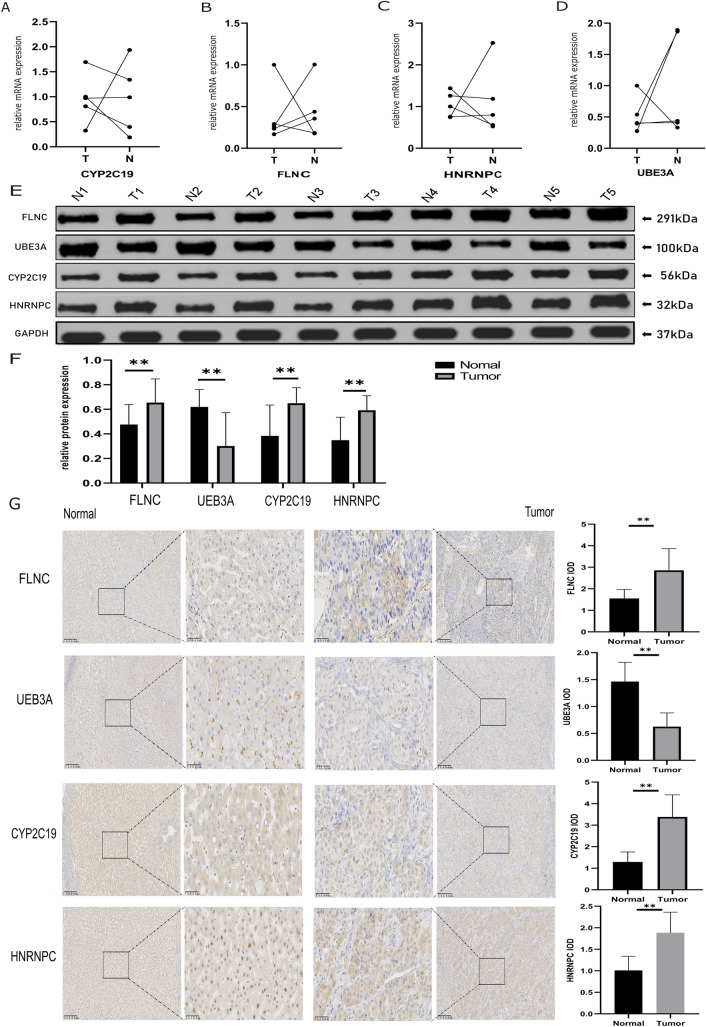
Results: The use of a prognosis potential genes risk assessment model can reliably predict the prognosis risk of patients, demonstrating strong predictive ability. Kaplan-Meier analysis showed that the overall survival rate of the low-risk group was significantly higher than that of the high-risk group. There were significant differences between the two subgroups in terms of immune infiltration and IC50 association analysis. Experimental verification revealed that CYP2C19, FLNC, and HNRNPC were highly expressed in liver cancer tissue, while UBE3A was expressed at a lower level.

Conclusion: PPGs can be used to predict the prognosis risk of HBV-HCC patients and play an important role in the diagnosis and treatment of liver cancer. They also reveal their potential role in the tumor immune microenvironment, clinical-pathological characteristics, and prognosis.

Keywords: Chemotherapy sensitivity; HBV-HCC; Immune infiltration; PPI; Prognosis.


Conflict of interest statement

The authors declare that they have no conflict of interest.

Figures

Fig. 1
Fig. 1
The LASSO and multivariate Cox regression model to identify potential genes. A The results of a multiple factor Cox regression analysis. B A bar chart. C A forest plot showing the potential genes selected by multiple regression screening, with hazard ratios indicating the risk ratio. The abscissa is the hazard ratio, and the line segment parallel to the horizontal axis is the confidence interval. The squares in the line segment represent the point estimate. The right side represents risk factors, and the left side represents protective factors. P < 0.05 considered statistically significant. D Lasso correlation coefficient. The x-axis represents the logarithm of the penalty coefficient, and the y-axis represents the variable shear coefficient. E Lasso cross-validation, with the x-axis representing the logarithm of the value and the y-axis representing the cross-validation error, with the dashed line indicating the position of the minimum cross-validation error
Fig. 2
Fig. 2
ROC for predicting survival in the datasets. In the training dataset, A, B and in the first, second, and third validation datasets, C–H respectively, ROC curves were plotted for the 3-year and 5-year survival rates of patients with clear cell renal cell carcinoma. The red curve represents the risk value, the green curve represents age, and the blue curve represents tumor staging. True positive rate represents the proportion of patients correctly predicted to survive by the model
Fig. 3
Fig. 3
The Kaplan–Meier curves illustrating the overall survival of individuals categorized into high-risk and low-risk groups based on their median risk score. A Training set, B first validation set, C second validation set, and D third validation set survival curves for high- and low-risk groups. The x-axis represents survival time (time) and the y-axis represents survival probability. The bottom graph shows the number of surviving patients in the high- and low-risk groups over time. The red curve represents the high-risk group and the green curve represents the low-risk group
Fig. 4
Fig. 4
The survival status, risk score distribution, and risk gene expression in the datasets. The distribution of survival status of HBV-HCC patients in the A, B, G, H training set and validation sets 1–3 is shown, with green indicating surviving patients and red indicating deceased patients. The C, D, I, J training set and validation sets 1–3 show the distribution of risk scores, with red indicating scores greater than the median and green indicating scores lower than the median. The E, F, K, L training set and validation sets 1–3 display a heatmap of risk gene expression, with type indicating grouping and high (blue) representing the high-risk group and low (red) representing the low-risk group. Gene expression colors range from red to green, indicating high to low expression levels
Fig. 5
Fig. 5
Further hierarchical survival analysis of different subgroups. A, B Show subgroups aged < 65 years and ≥ 65 years. C, D Show subgroups of males and females by gender. EG Show the tumor grading as Grade I, Grade II, and Grade III. IK Show pathological stages I, II, and III. K, L show pathological T1–2 and T3–4 stages. M Wilcoxon test was used to compare the differences in risk scores among subgroups such as age, tumor grade, tumor stage, pathological T stage, and gender. Pathological T stage (pT) is an independent prognostic factor in patients with HBV-HCC. The abscissa is the hazard ratio, and the line segment parallel to the horizontal axis is the confidence interval. The squares in the line segment represent the point estimate. The right side represents risk factors, and the left side represents protective factors. P < 0.05 considered statistically significant
Fig. 6
Fig. 6
Correlation between risk model and six immune cell infiltration abundances. AF Depict the correlation between risk scores and six types of tumor-infiltrating immune cells, including B cells (A), CD4 T cells (B), CD8 T cells (C), neutrophils (D), macrophages (E), and myeloid dendritic cells (F). The x-axis represents the distribution of model scores, while the y-axis represents the distribution of immune scores. The density curves on the right and top sides indicate the trend of immune and model score distributions, respectively. The topmost numerical value indicates the P value, correlation coefficient, and method of correlation calculation
Fig. 7
Fig. 7
Risk score prediction for response to immunotherapy and chemotherapy. A–E Comparison of immune checkpoint genes stratified by the expression levels of risk score (A), CYP2C19 (D), FLNC (E), HNRNPC (F), and UBE3A (G). B Depicts a comparison of ICB response scores based on risk scores and expression levels of CYP2C19, FLNC, HNRNPC, and UBE3A. C Depicts a comparison of IC50 sensitivity of sorafenib, axitinib, sunitinib, and trametinib based on risk scores
Fig. 8
Fig. 8
Verification of mRNA and protein expression levels of four risk-associated genes in HBV-HCC. A–D mRNA expression levels of genes were compared between five pairs of HBV-HCC tissues and adjacent normal tissues using qRT-PCR. E, F Western blot analysis was performed. G Immunohistochemical staining and quantitative analysis of ten pairs of HBV-HCC tissues and adjacent normal tissues

Similar articles

References

    1. Abdelgalil AA, Alkahtani HM, Al-Jenoobi FI (2019) Sorafenib. Profiles Drug Subst Excip Relat Methodol 44:239–266 - PubMed
    1. Alanis-Lobato G, Andrade-Navarro MA, Schaefer MH (2017) HIPPIE v2.0: enhancing meaningfulness and reliability of protein-protein interaction networks. Nucleic Acids Res 45:D408-d414 - PMC - PubMed
    1. Alexopoulou A, Vasilieva L, Karayiannis P (2020) New approaches to the treatment of chronic hepatitis B. J Clin Med 9:3187 - PMC - PubMed
    1. Aran D, Hu Z, Butte AJ (2017) xCell: digitally portraying the tissue cellular heterogeneity landscape. Genome Biol 18:220 - PMC - PubMed
    1. Arneth B (2019) Tumor microenvironment. Medicina (kaunas) 56:15 - PMC - PubMed

LinkOut - more resources