. 2023 Jun 5:15:1180987.
doi: 10.3389/fnagi.2023.1180987. eCollection 2023.

c-Abl tyrosine kinase down-regulation as target for memory improvement in Alzheimer's disease

Affiliations

c-Abl tyrosine kinase down-regulation as target for memory improvement in Alzheimer's disease

Rilda León et al. Front Aging Neurosci. .

Abstract

Background: Growing evidence suggests that the non-receptor tyrosine kinase, c-Abl, plays a significant role in the pathogenesis of Alzheimer's disease (AD). Here, we analyzed the effect of c-Abl on the cognitive performance decline of APPSwe/PSEN1ΔE9 (APP/PS1) mouse model for AD.

Methods: We used the conditional genetic ablation of c-Abl in the brain (c-Abl-KO) and pharmacological treatment with neurotinib, a novel allosteric c-Abl inhibitor with high brain penetrance, imbued in rodent's chow.

Results: We found that APP/PS1/c-Abl-KO mice and APP/PS1 neurotinib-fed mice had improved performance in hippocampus-dependent tasks. In the object location and Barnes-maze tests, they recognized the displaced object and learned the location of the escape hole faster than APP/PS1 mice. Also, APP/PS1 neurotinib-fed mice required fewer trials to reach the learning criterion in the memory flexibility test. Accordingly, c-Abl absence and inhibition caused fewer amyloid plaques, reduced astrogliosis, and preserved neurons in the hippocampus.

Discussion: Our results further validate c-Abl as a target for AD, and the neurotinib, a novel c-Abl inhibitor, as a suitable preclinical candidate for AD therapies.

Keywords: Alzheimer’s disease; Hippocampi; c-Abl inhibitors; memory; tyrosine kinases.


Conflict of interest statement

The authors declare that the research was conducted in the absence of any commercial or financial relationships that could be construed as a potential conflict of interest. Neurotinib is under the patent WO2019/173761 A1.

Figures
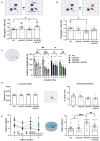
Figure 1
Figure 1
c-Abl absence improves behavioral performance in hippocampus-dependent tasks. 10-month-old wild-type (WT), c-Abl conditional knock-out mice (c-Abl KO), and AD mice either WT for c-Abl (APP/PS1) or knock-out for c-Abl (APP/PS1/c-Abl KO) were sequentially subjected to learning tasks as indicated by each cartoon. (A) Object Location Memory test. The graph shows the time spent on the relocated object compared to the total exploration time. APP/PS1 vs. APP/PS1/c-Abl KO p = 0.0506 Tukey’s post-hoc test. Two-way ANOVA p** = 0.0024 genotype effect, Tukey’s multiple comparison test @ p < 0.05 vs. chance level (0.5). (B) Novel Object Recognition test. Graph shows the time spent smelling the new object, compared with total exploration time. APP/PS1 vs. APP/PS1/c-Abl KO p = 0.4407 Tukey’s post-hoc multiple comparison test. Two-way ANOVA p = 0.0552 genotype (Continued)FIGURE 1 (Continued)and APP condition effect; @ p < 0.05 vs. chance level (0.5). (C) Graph shows the time spent finding the target hole each day of the Barnes maze test. Two-way ANOVA p** = 0.0054 genotype effect, p*** < 0.0001 acquisition day effect, Tukey’s post-hoc multiple comparison test. (D) Open Field tests. In each case, the bar shows the percent of time spent exploring the center zone (Anxiety-like behavior, p = 0.7625) and the distance traveled during the whole exploratory time (basal locomotor activity, p = 0.7690). Two-way ANOVA, Tukey’s post-hoc multiple comparison test. Same n = 10 WT, 10 APP/PS1, 8 APP/PS1/c-Abl KO, and 11 c-Abl KO animals on each test. (E) Memory flexibility test of 10-month-old mice. Left: graph show the number of mice attempts to find the platform in each position at different training days. Asterisks indicate WT vs. APP/PS1 significance through training days (1st day p = 0.0419, 3rd day p = 0.0242, 4th day p = 0.0419; APP vs. APP/PS1/c-Abl KO 1st day p = 0.089, 3rd day p = 0.4904, 4th day p = 0.7607). Two-way ANOVA, p = 0.0063 training day’s effect, p < 0.0001 genotype effect, Tukey’s multiple comparison test. Right: graph shows the total number of trials to reach the learning criterion for each group. Two-way ANOVA genotype and trials needed effect: p = 0.0164. n = 8 WT, 6 APP/PS1, 8 APP/PS1/c-Abl KO, and 6 c-Abl KO animals. Data are presented as mean ± SEM. p* < 0.05.
Figure 2
Figure 2
c-Abl absence and neurotinib-diet improve the cognitive performance of AD mice in hippocampus-dependent tasks. (A) WT and APP/PS1 mice were fed for 4 months with a control diet or diet containing 67 ppm of neurotinib before starting the cognitive tests. At 20-month-old, mice were subjected to learning tasks with resting periods between them, and maintenance of ad libitum respective diets until tissues were collected. (B) Novel Object Recognition test. Graph shows the time spent around the new object, compared to the total exploration time. The dotted line represents the chance. Two-way ANOVA genotype effect: p = 0.9573, treatment effect: p = 0.5689. (C) Morris Water Maze test. Graph shows the time to find the platform during 8-training days (escape latency) @ mean significantly different from 0.5. α: days in which APP/PS1 is different in comparison to another group. Three-way ANOVA, Tukey post-hoc multiple comparison test, genotype effect: p < 0.0001, treatment effect: p = 0.0361, day: p < 0.0001, days × treatment: p = 0.0237. (D) Graphs show the memory flexibility task results as the number of attempts to find the platform in each position at different training days (left), and the number of trials to reach the learning criterion for each group (right, treatment and acquisition day effect p = 0.1195, neurotinib effect p < 0.0001). Significance was annotated for APP/PS1 vs. WT mice (1st day p** = 0.0016, 2nd day p** = 0.016, 3rd day p** = 0.0033, 4th day p** = 0.0033). @ mean significant different between APP/PS1 vs. APP/PS1-neurotinib fed mice p** = 0.0027. Two-way ANOVA, Tukey’s post-hoc multiple comparison test. (E) Open field test for anxiety-like behavior (left, p = 0.8962) and locomotor activity evaluation (right, p = 0.7167) of neurotinib-fed mice. Bar shows the percent of time spent exploring the center zone, and the distance traveled during the whole exploratory time. Two-way ANOVA, Tukey post-hoc multiple comparison test: WT-neurotinib vs. APP/PS1-neurotinib: p* = 0.0378. Same n = 10 WT-control diet, 12 APP-control diet, 11 WT-neurotinib diet, and 10 APP-neurotinib fed animals for each test. Data are shown as mean ± SEM.
Figure 3
Figure 3
c-Abl absence and inhibition reduced amyloid-beta burden, neuroinflammation, and reduced neuronal loss in the APP/PS1 mice model of AD. (A,B) Representative immunofluorescences from coronal brain sections stained with WO2 antibody for amyloid-beta plaques in green. Graph shows the number of amyloid-beta plaques per mm2 and the percentage area of each plaque in relation to the cortex and hippocampus brain area. n = 4 animals, 2 slices per genotype or treatment. Scale bar = 1 mm. (A) 10-month-old APP/PS1 and APP/PS1/c-Abl KO mice, n = 3–4 animals per genotype. Two-way ANOVA, post-hoc Tukey’s multiple comparison test, p** = 0.0073 for plaques/mm2, left; p*** = 0.0005 for plaques area (%), right. (B) 22-month-old APP/PS1 mice fed with control or neurotinib diet. Non-parametric Mann–Whitney t-test p* = 0.0350 for plaques/mm2, left; p** = 0.0040 for plaques area (%), right. (C,D) Representative immunofluorescences from coronal brain sections for the astrocyte marker GFAP (green), NeuN marker for neurons in the hippocampus (red), and the nucleus (Hoechst, blue). Graphs show the number of astrocytes per mm2. n = 3–4 animals per genotype or treatment. Scale bar = 200 μm. (C) 10-month-old WT, c-Abl KO, APP/PS1, and APP/PS1/c-Abl KO mice. Two-way ANOVA, post-hoc Tukey’s multiple comparison test, c-Abl absence effect p = 0.0651. c-Abl KO vs. APP/PS1/c-Abl KO p = 0.3509. (D) 22-month-old APP/PS1 mice fed with control or neurotinib diet. Non-parametric Mann–Whitney t-test p = 0.4. (E) Same immunofluorescences for the neuronal marker in (D), NeuN, of 22-month-old mice fed with control or neurotinib diet are presented in grayscale. Red arrows indicate the discontinuities found in the CA3 and CA1 areas of the hippocampus augmented from the coronal brain sections shown in (D) (dotted white square). n = 3–5 animals per condition. Scale bar = 10 μm. (F) Graph shows the number of discontinuities in the CA3 or CA1 hippocampi. Two-way ANOVA, post-hoc Tukey’s multiple comparison test, p*** = 0.0001 treatment effect. (G) Graph shows the total number of NeuN+ positive cells counted and normalized per CA3 or CA1 areas (μm2). Two-way ANOVA, post-hoc Tukey’s multiple comparison test, p = 0.1335 treatment effect. Data are presented as mean ± SEM. p*** < 0.0001.

References

    1. Aghel N., Delgado D., Lipton J. H. (2017). Cardiovascular toxicities of BCR-ABL tyrosine kinase inhibitors in chronic myeloid leukemia: preventive strategies and cardiovascular surveillance. Vasc. Health Risk Manag. 13, 293–303. doi: 10.2147/VHRM.S108874, PMID: - DOI - PMC - PubMed
    1. Alvarez A. R., Sandoval P. C., Leal N. R., Castro P. U., Kosik K. S. (2004). Activation of the neuronal c-Abl tyrosine kinase by amyloid-beta-peptide and reactive oxygen species. Neurobiol. Dis. 17, 326–336. doi: 10.1016/j.nbd.2004.06.007, PMID: - DOI - PubMed
    1. Angel A., Volkman R., Royal T. G., Offen D. (2020). Caspase-6 knockout in the 5xFAD model of Alzheimer’s disease reveals favorable outcome on memory and neurological hallmarks. Int. J. Mol. Sci. 21:1144. doi: 10.3390/ijms21031144, PMID: - DOI - PMC - PubMed
    1. Antunes M., Biala G. (2012). The novel object recognition memory: neurobiology, test procedure, and its modifications. Cogn. Process. 13, 93–110. doi: 10.1007/s10339-011-0430-z, PMID: - DOI - PMC - PubMed
    1. Atwood C. S., Bowen R. L. (2015). A unified hypothesis of early- and late-onset Alzheimer’s disease pathogenesis. JAD 47, 33–47. doi: 10.3233/JAD-143210, PMID: - DOI - PMC - PubMed