

Predicting prognosis, immunotherapy and distinguishing cold and hot tumors in clear cell renal cell carcinoma based on anoikis-related lncRNAs
- PMID: 37359524
- PMCID: PMC10288194
- DOI: 10.3389/fimmu.2023.1145450
Predicting prognosis, immunotherapy and distinguishing cold and hot tumors in clear cell renal cell carcinoma based on anoikis-related lncRNAs
Abstract
Background: Clear cell renal cell carcinoma (ccRCC) is the most frequently occurring malignant tumor within the kidney cancer subtype. It has low sensitivity to traditional radiotherapy and chemotherapy, the optimal treatment for localized ccRCC has been surgical resection, but even with complete resection the tumor will be eventually developed into metastatic disease in up to 40% of localized ccRCC. For this reason, it is crucial to find early diagnostic and treatment markers for ccRCC.
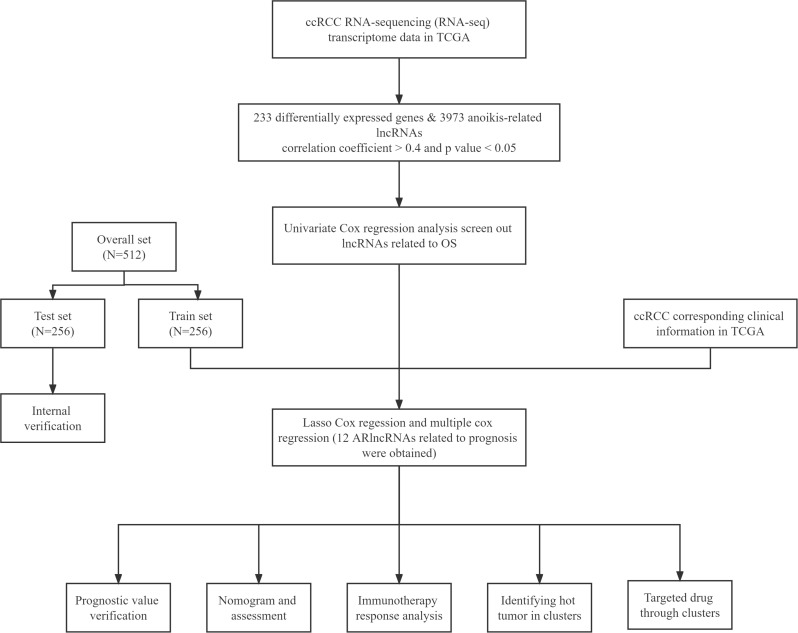
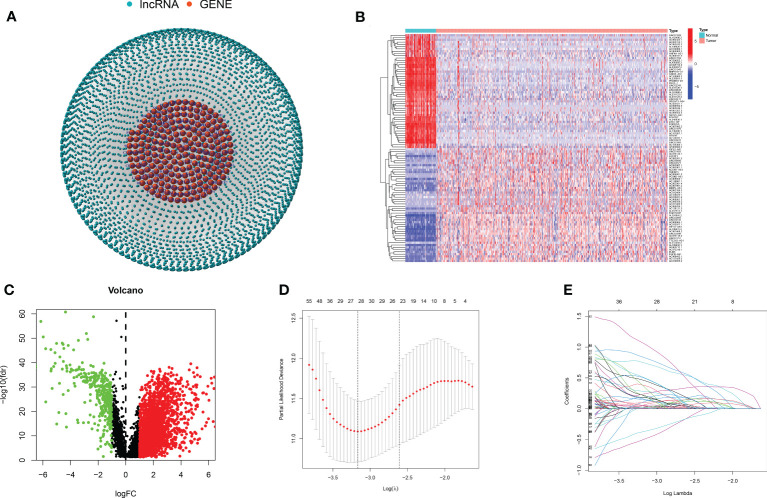
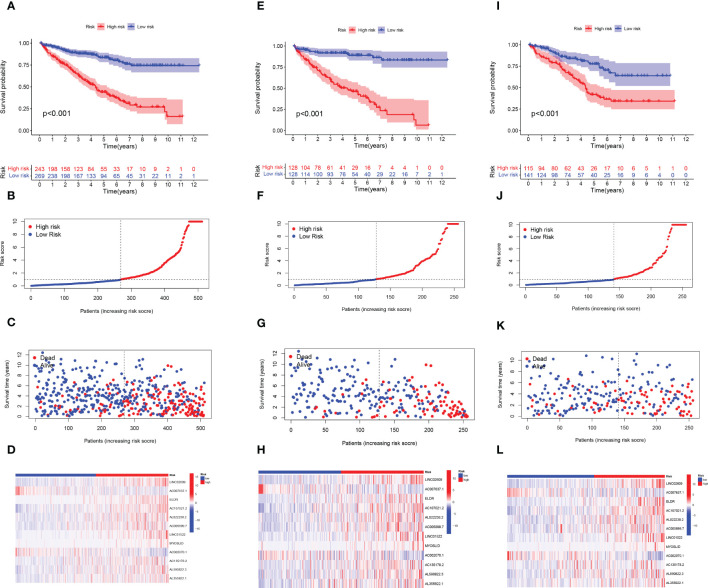
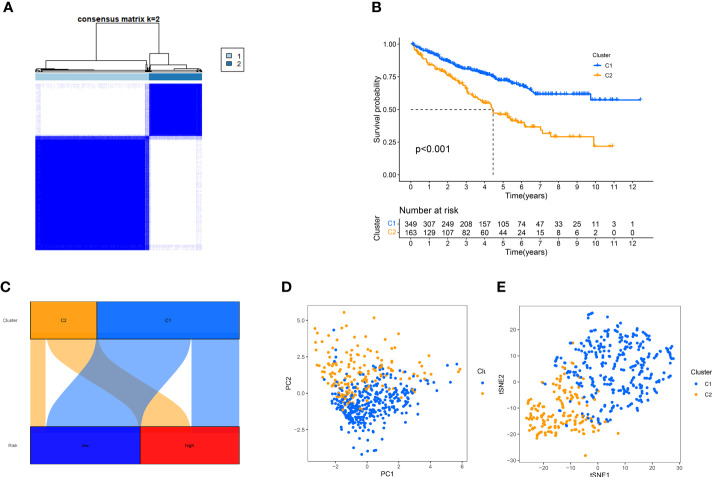
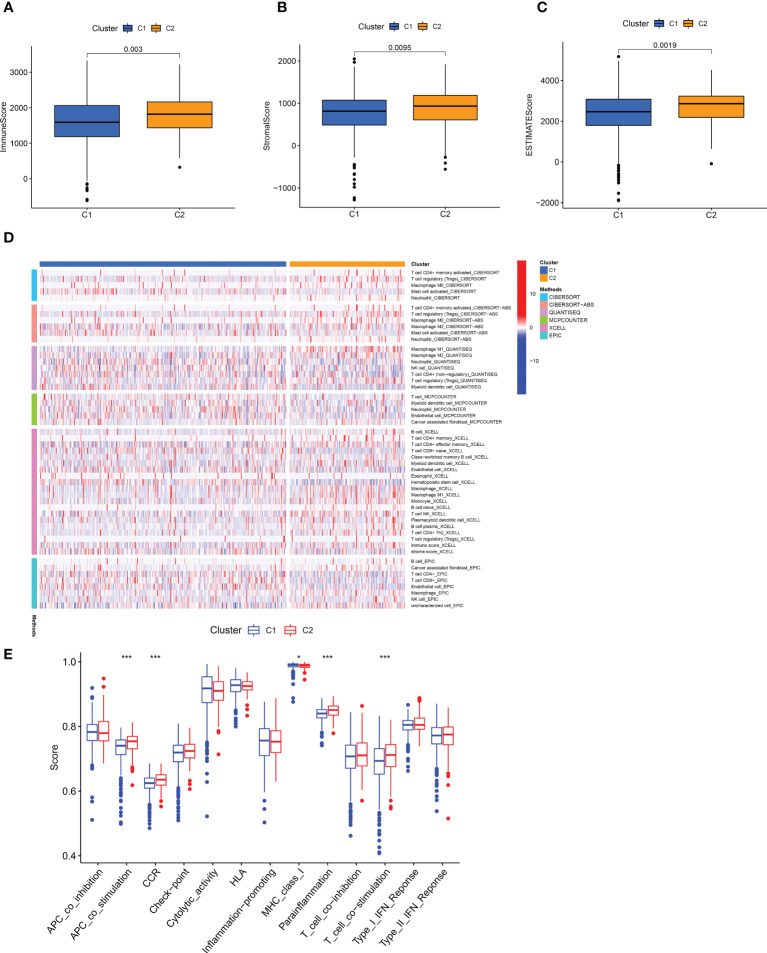
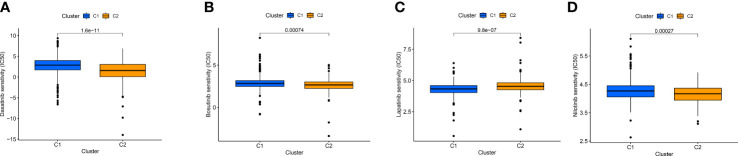
Methods: We obtained anoikis-related genes (ANRGs) integrated from Genecards and Harmonizome dataset. The anoikis-related risk model was constructed based on 12 anoikis-related lncRNAs (ARlncRNAs) and verified by principal component analysis (PCA), Receiver operating characteristic (ROC) curves, and T-distributed stochastic neighbor embedding (t-SNE), and the role of the risk score in ccRCC immune cell infiltration, immune checkpoint expression levels, and drug sensitivity was evaluated by various algorithms. Additionally, we divided patients based on ARlncRNAs into cold and hot tumor clusters using the ConsensusClusterPlus (CC) package.
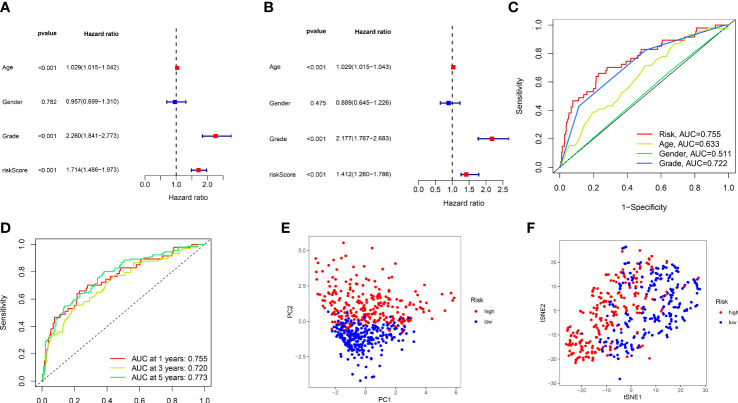
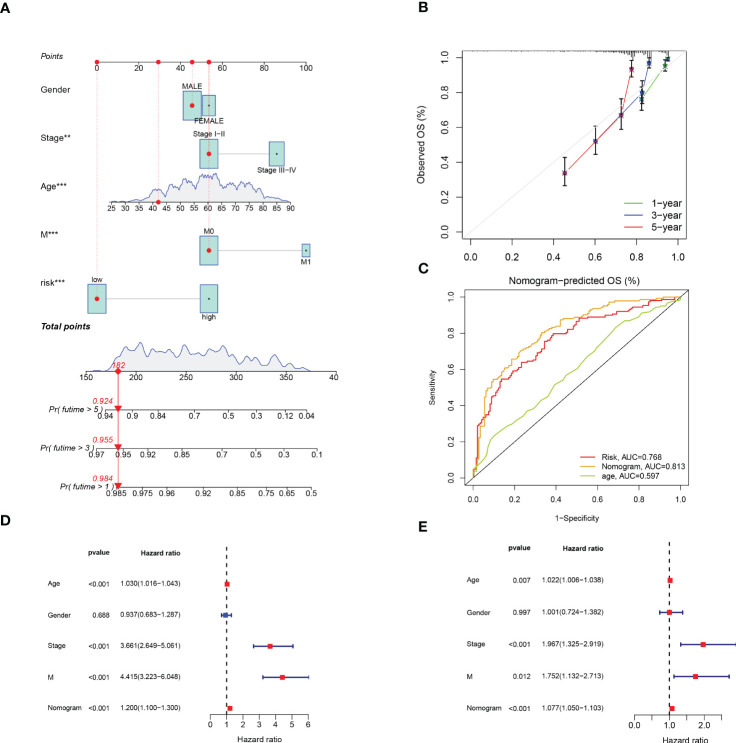
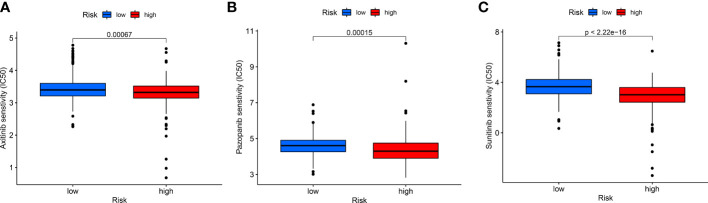
Results: The AUC of risk score was the highest among various factors, including age, gender, and stage, indicating that the model we built to predict survival was more accurate than the other clinical features. There was greater sensitivity to targeted drugs like Axitinib, Pazopanib, and Sunitinib in the high-risk group, as well as immunotherapy drugs. This shows that the risk-scoring model can accurately identify candidates for ccRCC immunotherapy and targeted therapy. Furthermore, our results suggest that cluster 1 is equivalent to hot tumors with enhanced sensitivity to immunotherapy drugs.
Conclusion: Collectively, we developed a risk score model based on 12 prognostic lncRNAs, expected to become a new tool for evaluating the prognosis of patients with ccRCC, providing different immunotherapy strategies by screening for hot and cold tumors.
Keywords: anoikis; clear cell renal cell carcinoma; hot and cold tumors; immunotherapy; lncRNA; prognostic biomarkers.
Copyright © 2023 Hao, Li, Lu, He, Shen, Wang and Qiu.
Conflict of interest statement
The authors declare that the research was conducted in the absence of any commercial or financial relationships that could be construed as a potential conflict of interest.
Figures
Similar articles
-
Computational construction of TME-related lncRNAs signature for predicting prognosis and immunotherapy response in clear cell renal cell carcinoma.J Clin Lab Anal. 2022 Aug;36(8):e24582. doi: 10.1002/jcla.24582. Epub 2022 Jul 8. J Clin Lab Anal. 2022. PMID: 35808868 Free PMC article.
-
A novel necroptosis-related long noncoding RNA model for predicting clinical features, immune characteristics, and therapeutic response in clear cell renal cell carcinoma.Front Immunol. 2023 Aug 2;14:1230267. doi: 10.3389/fimmu.2023.1230267. eCollection 2023. Front Immunol. 2023. PMID: 37600792 Free PMC article.
-
Exosome-related lncRNA score: A value-based individual treatment strategy for predicting the response to immunotherapy in clear cell renal cell carcinoma.Cancer Med. 2024 Jun;13(11):e7308. doi: 10.1002/cam4.7308. Cancer Med. 2024. PMID: 38808948 Free PMC article.
-
A new CCCH-type zinc finger-related lncRNA signature predicts the prognosis of clear cell renal cell carcinoma patients.Front Genet. 2022 Sep 30;13:1034567. doi: 10.3389/fgene.2022.1034567. eCollection 2022. Front Genet. 2022. PMID: 36246657 Free PMC article.
-
Diagnostic, predictive and prognostic molecular biomarkers in clear cell renal cell carcinoma: A retrospective study.Cancer Rep (Hoboken). 2024 Jun;7(6):e2116. doi: 10.1002/cnr2.2116. Cancer Rep (Hoboken). 2024. PMID: 38837683 Free PMC article. Review.
Cited by
-
LINC01094: A key long non-coding RNA in the regulation of cancer progression and therapeutic targets.Heliyon. 2024 Sep 7;10(18):e37527. doi: 10.1016/j.heliyon.2024.e37527. eCollection 2024 Sep 30. Heliyon. 2024. PMID: 39309878 Free PMC article. Review.
-
The Role of Long Non-Coding RNF144A-AS1 in Cancer Progression.Cell Biochem Biophys. 2024 Sep;82(3):2007-2017. doi: 10.1007/s12013-024-01411-9. Epub 2024 Jul 16. Cell Biochem Biophys. 2024. PMID: 39014185 Review.
-
The cross-talk between macrophages and tumor cells as a target for cancer treatment.Front Oncol. 2023 Nov 14;13:1259034. doi: 10.3389/fonc.2023.1259034. eCollection 2023. Front Oncol. 2023. PMID: 38033495 Free PMC article. Review.
-
Development of anoikis-related long non-coding RNA signature associated with prognosis and immune landscape in cutaneous melanoma patients.Aging (Albany NY). 2023 Aug 4;15(15):7655-7672. doi: 10.18632/aging.204932. Epub 2023 Aug 4. Aging (Albany NY). 2023. PMID: 37543428 Free PMC article.
-
Identification of a Novel Oxidative Stress- and Anoikis-Related Prognostic Signature and Its Immune Landscape Analysis in Non-Small Cell Lung Cancer.Int J Mol Sci. 2023 Nov 10;24(22):16188. doi: 10.3390/ijms242216188. Int J Mol Sci. 2023. PMID: 38003378 Free PMC article.
References
-
- Wolff I, May M, Hoschke B, Zigeuner R, Cindolo L, Hutterer G, et al. . Do we need new high-risk criteria for surgically treated renal cancer patients to improve the outcome of future clinical trials in the adjuvant setting? results of a comprehensive analysis based on the multicenter corona database. Eur J Surg Oncol (2016) 42(5):744–50. doi: 10.1016/j.ejso.2016.01.009 - DOI - PubMed
Publication types
MeSH terms
Substances
LinkOut - more resources
Full Text Sources
Medical