. 2023 Jun 9:14:1202529.
doi: 10.3389/fimmu.2023.1202529. eCollection 2023.

Bioinformatic analysis of hub markers and immune cell infiltration characteristics of gastric cancer

Affiliations

Bioinformatic analysis of hub markers and immune cell infiltration characteristics of gastric cancer

Chao Li et al. Front Immunol. .

Abstract

Background: Gastric cancer (GC) is the fifth most common cancer and the second leading cause of cancer-related deaths worldwide. Due to the lack of specific markers, the early diagnosis of gastric cancer is very low, and most patients with gastric cancer are diagnosed at advanced stages. The aim of this study was to identify key biomarkers of GC and to elucidate GC-associated immune cell infiltration and related pathways.

Methods: Gene microarray data associated with GC were downloaded from the Gene Expression Omnibus (GEO). Differentially expressed genes (DEGs) were analyzed using Gene Ontology (GO), Kyoto Gene and Genome Encyclopedia, Gene Set Enrichment Analysis (GSEA) and Protein-Protein Interaction (PPI) networks. Weighted gene coexpression network analysis (WGCNA) and the least absolute shrinkage and selection operator (LASSO) algorithm were used to identify pivotal genes for GC and to assess the diagnostic accuracy of GC hub markers using the subjects' working characteristic curves. In addition, the infiltration levels of 28 immune cells in GC and their interrelationship with hub markers were analyzed using ssGSEA. And further validated by RT-qPCR.

Results: A total of 133 DEGs were identified. The biological functions and signaling pathways closely associated with GC were inflammatory and immune processes. Nine expression modules were obtained by WGCNA, with the pink module having the highest correlation with GC; 13 crossover genes were obtained by combining DEGs. Subsequently, the LASSO algorithm and validation set verification analysis were used to finally identify three hub genes as potential biomarkers of GC. In the immune cell infiltration analysis, infiltration of activated CD4 T cell, macrophages, regulatory T cells and plasmacytoid dendritic cells was more significant in GC. The validation part demonstrated that three hub genes were expressed at lower levels in the gastric cancer cells.

Conclusion: The use of WGCNA combined with the LASSO algorithm to identify hub biomarkers closely related to GC can help to elucidate the molecular mechanism of GC development and is important for finding new immunotherapeutic targets and disease prevention.

Keywords: LASSO; WGCNA; gastric cancer (GC); hub markers; immune cell infiltration.


Conflict of interest statement

The authors declare that the research was conducted in the absence of any commercial or financial relationships that could be construed as a potential conflict of interest.

Figures
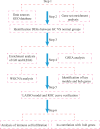
Figure 1
Figure 1
Flowchart of integrated bioinformatic analysis of hub markers and immune cell infiltration characteristics of GC.
Figure 2
Figure 2
Differentially expressed genes between GC patients and healthy controls. (A) Heatmap of the top 50 up- and down-regulated genes. (B) DEGs volcano plot between healthy controls and GC tissue.
Figure 3
Figure 3
Functional enrichment analysis of DEGs and their PPI construction. (A) GO enrichment analysis. The first circle indicates the name of the GO; the second circle represents the number of genes on each GO. (The redder the color, the more significant the enrichment of DEGs); the third circle indicates the number of differential genes enriched on each GO term; and the fourth circle represents the proportion of genes. (B) KEGG pathway enrichment analysis. The different line colors indicate the different pathways to which they belong. Yellow dots are pathways, with larger dots indicating more genes involved. The other dots represent genes, the redder the gene the higher the expression level in GC patients and vice versa, the bluer the color. The top eight pathways for significant enrichment of differential genes were demonstrated. (C) Protein-protein interaction (PPI) network.
Figure 4
Figure 4
Enrichment plot for GSEA. (A) Active gene sets in healthy controls. (B) Active gene set in GC group.
Figure 5
Figure 5
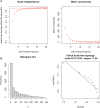
(A) Soft thresholds for determining the best scale-free topological model fit index (left) and average connectivity (right), with the red horizontal line indicating R2 = 0.9. (B) The distribution of the connectivity of each node in the network (left) and node degree power distribution (right).
Figure 6
Figure 6
Identification of key modules based on WGCNA. (A) GC-related gene clustering dendrogram. In the figure, the top half is a hierarchical clustering tree diagram of the genes, and the bottom half is the gene modules, or network modules. Genes with relative relatedness are located on the same or adjacent branches. (B) Heatmap of correlation analysis of the modules and clinical traits. (C) Gene significance in the modules. (D) Scatter plots of GS score and MM for genes in the pink module.
Figure 7
Figure 7
LASSO screening for hub genes. (A) Venn diagram of intersecting genes between DEGs and the pink module. (B) Coefficients distribution trend of LASSO regression. (C) Distribution of hub genes in cross validation.
Figure 8
Figure 8
Expression levels of the three Hub genes between the normal control and GC groups. (A) Boxplot of these hub genes in the training dataset. (B) Boxplot of hub genes in the validation dataset. (***P<0.001).
Figure 9
Figure 9
Diagnostic value of the three genes. (A) ROC curves of hub genes in the training dataset. (B) ROC curves of hub genes in the validation dataset.
Figure 10
Figure 10
Analysis of immune cell infiltration and its correlation with characteristic hub genes. (A) Heat map of immune cell infiltration between normal control and GC group (B) Violin diagram of the difference in immune cell infiltration between normal controls and GC. (C) Analysis of the association of 3 Hub genes with immune cells.
Figure 11
Figure 11
RT-qPCR validation of hub gene mRNA in different groups. The data presented are means ± SD (n=3). # P <0.05 and ## P <0.01 relative to the control group.

Similar articles

Cited by

References

    1. Januszewicz W, Turkot MH, Malfertheiner P, Regula J. A global perspective on gastric cancer screening: which concepts are feasible, and when? Cancers (Basel) (2023) 15(3):664. doi: 10.3390/cancers15030664 - DOI - PMC - PubMed
    1. Cao W, Chen HD, Yu YW, Li N, Chen WQ. Changing profiles of cancer burden worldwide and in China: a secondary analysis of the global cancer statistics 2020. Chin Med J (Engl) (2021) 134(7):783–91. doi: 10.1097/CM9.0000000000001474 - DOI - PMC - PubMed
    1. Li Y, Wang HC, Wang JS, Sun B, Li LP. Chemokine receptor 4 expression is correlated with the occurrence and prognosis of gastric cancer. FEBS Open Bio (2020) 10(6):1149–61. doi: 10.1002/2211-5463.12864 - DOI - PMC - PubMed
    1. Sexton RE, Al Hallak MN, Diab M, Azmi AS. Gastric cancer: a comprehensive review of current and future treatment strategies. Cancer Metastasis Rev (2020) 39(4):1179–203. doi: 10.1007/s10555-020-09925-3 - DOI - PMC - PubMed
    1. Smyth EC, Nilsson M, Grabsch HI, van Grieken NC, Lordick F. Gastric cancer. Lancet (2020) 396(10251):635–48. doi: 10.1016/S0140-6736(20)31288-5 - DOI - PubMed

Publication types