. 2023 Jun 8:14:1200725.
doi: 10.3389/fimmu.2023.1200725. eCollection 2023.

Increased plasma level of terminal complement complex in AMD patients: potential functional consequences for RPE cells

Affiliations

Increased plasma level of terminal complement complex in AMD patients: potential functional consequences for RPE cells

Catharina Busch et al. Front Immunol. .

Abstract

Purpose: Polymorphisms in complement genes are risk-associated for age-related macular degeneration (AMD). Functional analysis revealed a common deficiency to control the alternative complement pathway by risk-associated gene polymorphisms. Thus, we investigated the levels of terminal complement complex (TCC) in the plasma of wet AMD patients with defined genotypes and the impact of the complement activation of their plasma on second-messenger signaling, gene expression, and cytokine/chemokine secretion in retinal pigment epithelium (RPE) cells.

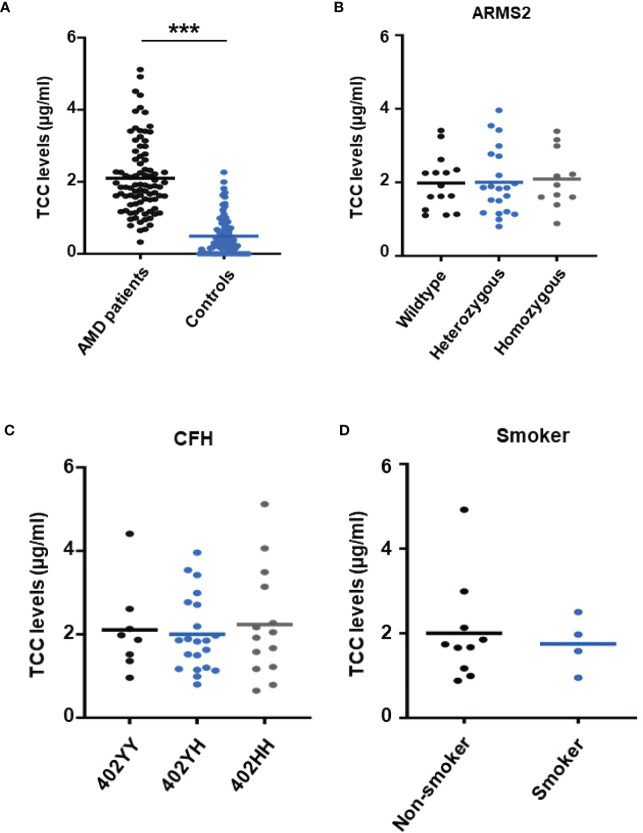
Design: Collection of plasma from patients with wet AMD (n = 87: 62% female and 38% male; median age 77 years) and controls (n = 86: 39% female and 61% male; median age 58 years), grouped for risk factor smoking and genetic risk alleles CFH 402HH and ARMS2 rs3750846, determination of TCC levels in the plasma, in vitro analysis on RPE function during exposure to patients' or control plasma as a complement source.

Methods: Genotyping, measurement of TCC concentrations, ARPE-19 cell culture, Ca2+ imaging, gene expression by qPCR, secretion by multiplex bead analysis of cell culture supernatants.

Main outcome measures: TCC concentration in plasma, intracellular free Ca2+, relative mRNA levels, cytokine secretion.

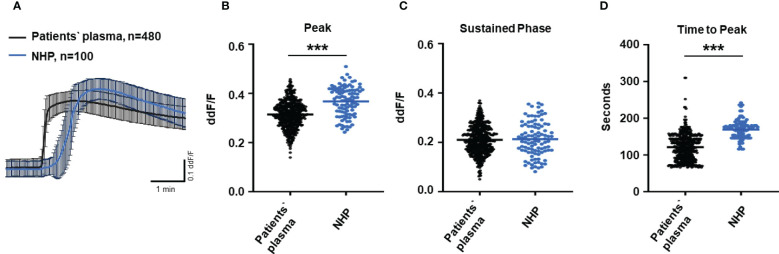
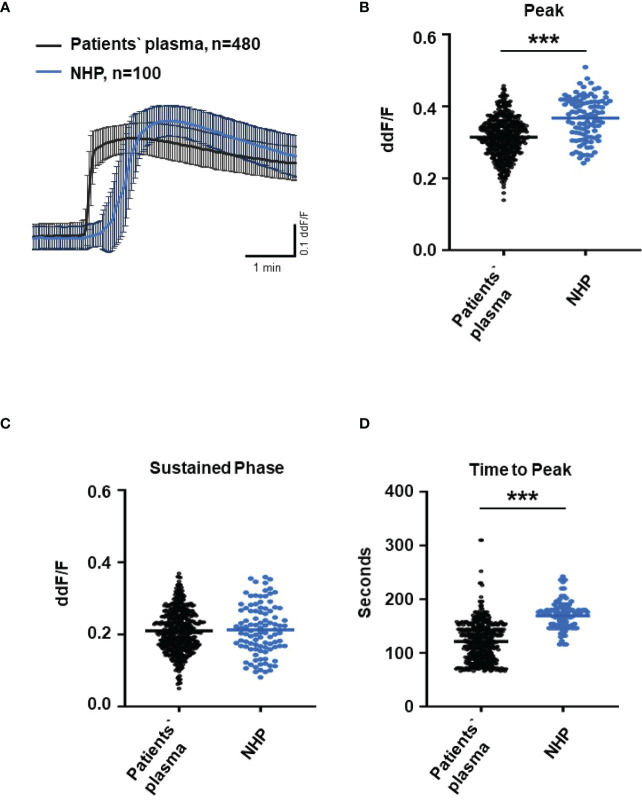
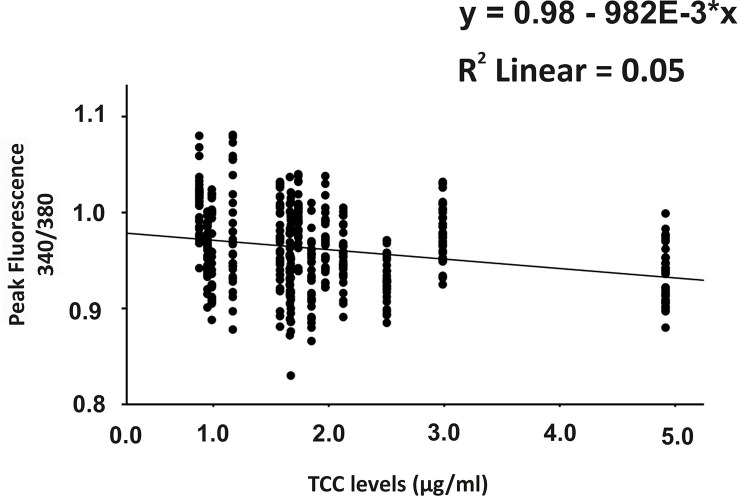
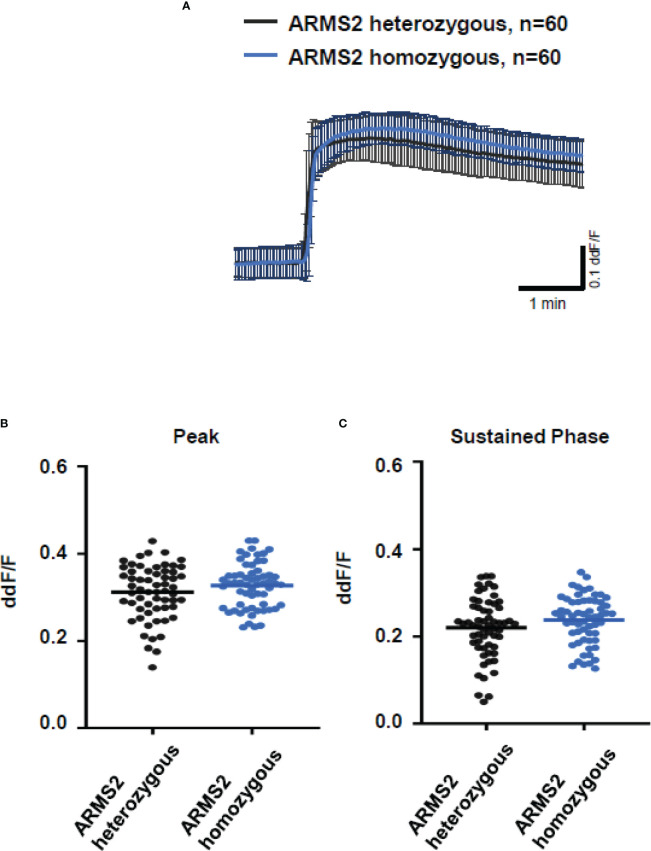
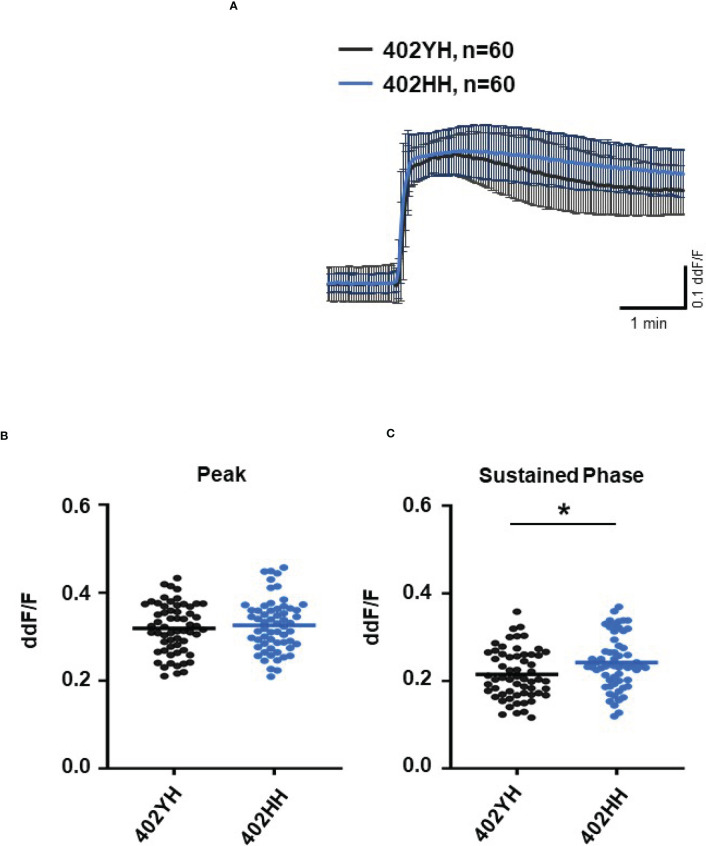
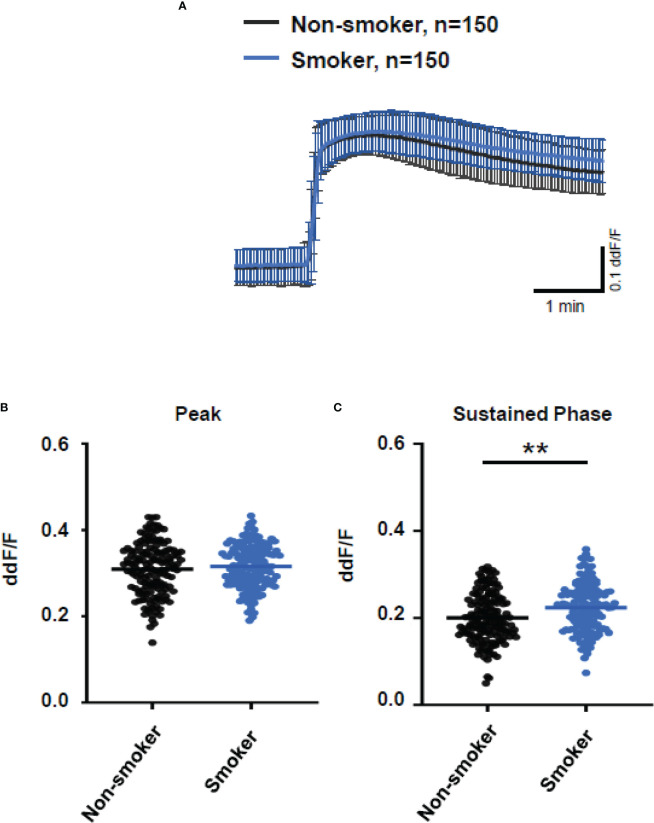
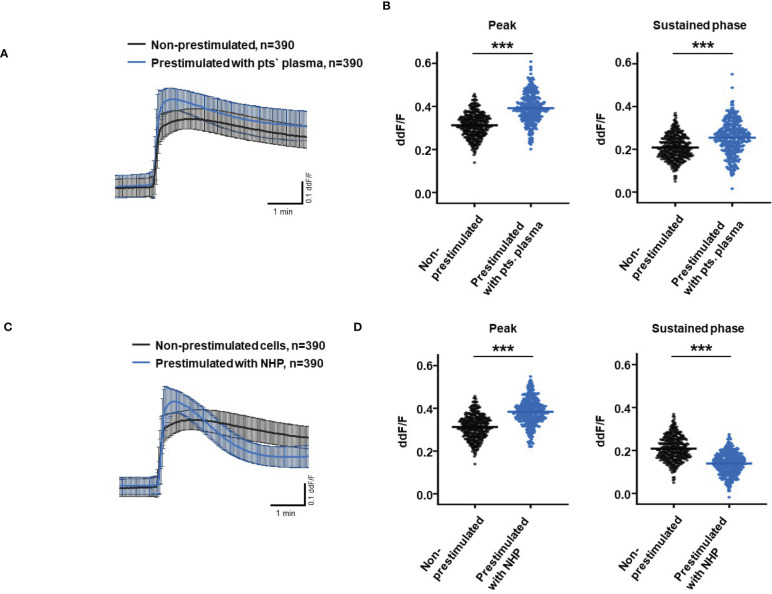
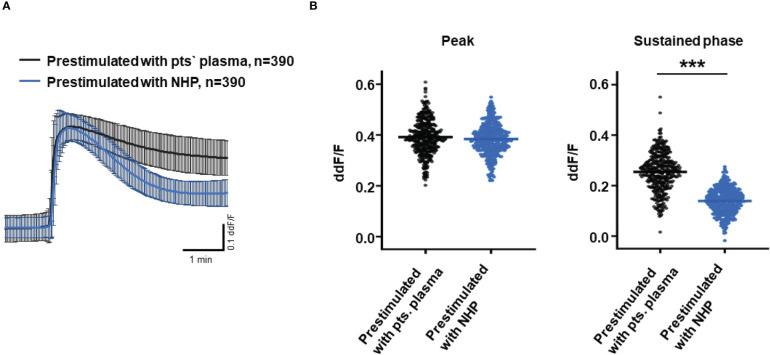
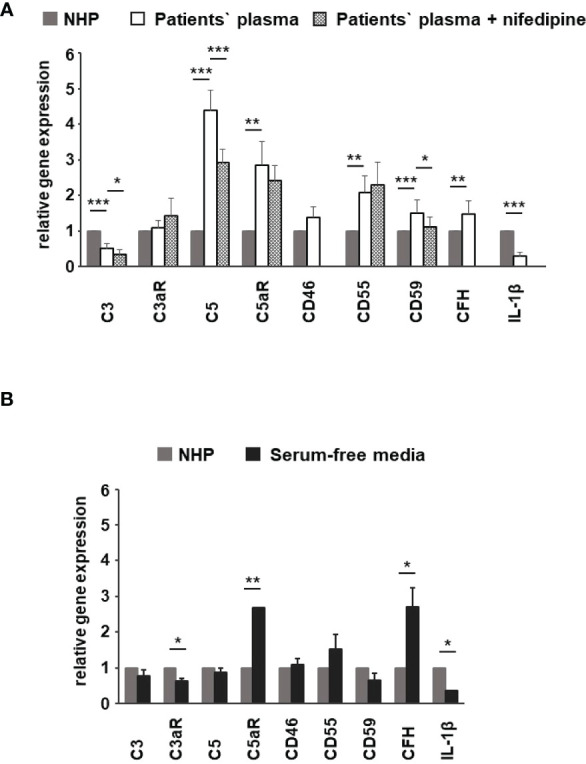
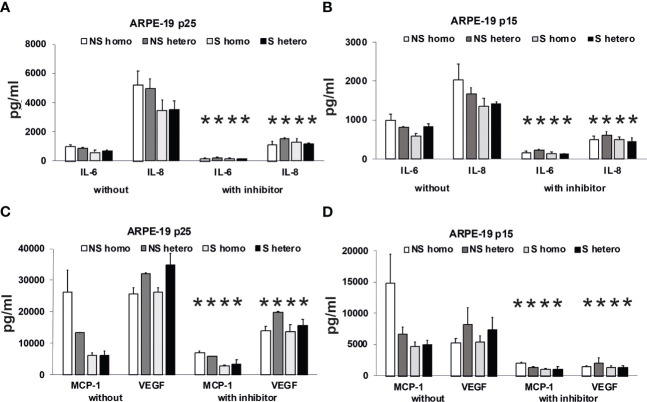
Results: TCC levels in the plasma of AMD patients were five times higher than in non-AMD controls but did not differ in plasma from carriers of the two risk alleles. Complement-evoked Ca2+ elevations in RPE cells differed between patients and controls with a significant correlation between TCC levels and peak amplitudes. Comparing the Ca2+ signals, only between the plasma of smokers and non-smokers, as well as heterozygous (CFH 402YH) and CFH 402HH patients, revealed differences in the late phase. Pre-stimulation with complement patients' plasma led to sensitization for complement reactions by RPE cells. Gene expression for surface molecules protective against TCC and pro-inflammatory cytokines increased after exposure to patients' plasma. Patients' plasma stimulated the secretion of pro-inflammatory cytokines in the RPE.

Conclusion: TCC levels were higher in AMD patients but did not depend on genetic risk factors. The Ca2+ responses to patients' plasma as second-messenger represent a shift of RPE cells to a pro-inflammatory phenotype and protection against TCC. We conclude a substantial role of high TCC plasma levels in AMD pathology.

Keywords: AMD serum; age-related macular degeneration; genetic risk factors; retinal pigment epithelium; terminal complement complex.


Conflict of interest statement

The authors declare that the research was conducted in the absence of any commercial or financial relationships that could be construed as a potential conflict of interest.

Figures

Figure 1
Figure 1
Plasma levels of terminal complement complex (TCC) in plasma from healthy donors and age-related macular degeneration (AMD) patients with AMD risk alleles. (A) Plasma levels of TCC (µg/ml) in AMD patients (n = 87) vs. healthy controls (n = 86) showing significantly higher TCC levels in AMD patients (p < 0.001). (B) TCC levels stratified for Age-related maculopathy-susceptibility 2 (ARMS2) risk alleles, with all patients carrying one Complement factor H (CFH 402YH) risk allele. No significant difference in TCC levels among patients with no (wild type (WT), n = 15), one (heterozygous, n = 21), and two (homozygous, n = 11) ARMS2 risk alleles existed. (C) TCC levels stratified for CFH risk alleles, with all patients carrying one ARMS2 risk allele. No significant difference in TCC levels among patients with no (CFH 402YY, n = 8), one (CFH 402YH, n = 21), and two (CFH 402HH, n = 14) CFH risk alleles. The horizontal lines represent the means of the TCC levels. ***p < 0.001 (Mann–Whitney U test). (D) TCC levels stratified for the risk factor smoking and non-smoking among patients who do not carry one of the investigated genetic risk alleles. As the “heterozygous patients” are heterozygous for CFH (CFH 402YH) and ARMS2, the same set of plasma samples from these patients was used for the comparison with homozygous deficient CFH (B) and ARMS2 (C) as well as with respective WT plasma.
Figure 2
Figure 2
Changes in Ca2+ transients activated by C6-depleted plasma and normal human plasma (NHP) in ARPE-19 cells. (A) Ca2+ transients are given as differences to the baseline in fluorescence ratio between the two excitation wavelengths 340 and 380 nm; plasma concentrations were 10%. Data are mean ± SEM. (B–D) Ca2+ transient changes at the initial peak phase and the late sustained phase. C6-depleted plasma induced a significantly lower change in intracellular free Ca2+ compared to NHP. The horizontal line represents the mean change in Ca2+ transients from baseline. ***p < 0.001 (Mann–Whitney U test).
Figure 3
Figure 3
Changes in Ca2+ transients activated by plasma from age-related macular degeneration patients. (A) Ca2+ transients are given as differences to the baseline in fluorescence ratio between the two excitation wavelengths 340 and 380 nm. Experiments were conducted with plasma (10%) from 16 different patients (30 cells per patient) and normal human plasma (NHP) in ARPE-19 cells. Data are mean ± SD. (B) Ca2+ transient changes at the initial peak phase and the late sustained phase. NHP induced a significantly higher change in intracellular free Ca2+ in the initial phase compared to patients’ plasma. (C, D) Mean time until maximum Ca2+ transient change. Patients’ plasma induced significantly faster maximum Ca2+ transients to change compared to NHP. The horizontal line represents the mean change in Ca2+ transients from baseline (B) and mean time until peak (C). ***p < 0.001 (Mann–Whitney U test).
Figure 4
Figure 4
Correlation analysis between plasma terminal complement complex (TCC) levels and the height of the plasma-induced Ca2+ peaks. Scatter plot of Ca2+ peak induced by patients’ plasma (given in 340/380 fluorescence ratio) over the individual TCC concentrations in the patients’ plasma. Correlation analysis was performed using the generalized estimated equation (GEE) model for longitudinal versus repeated measures (* = multiplies).
Figure 5
Figure 5
Changes in Ca2+ transients activated by plasma from age-related macular degeneration patients, stratified for age-related maculopathy susceptibility 2 (ARMS2) risk allele status. Plasma from patients carrying one (heterozygous) vs. two (homozygous) ARMS2 risk alleles (2 different patients per risk allele status, 30 cells per patient). All patients were age-matched and had no additional Complement factor H risk alleles. (A) Ca2+ transients are given as differences to the baseline in fluorescence ratio between the two excitation wavelengths 340 and 380 nm; plasma was used in concentrations of 10%. Data are mean ± SD. (B, C) Ca2+ transient changes at the initial peak phase and the late sustained phase induced by plasma from patients with one vs. two ARMS2 risk alleles, showing no significant differences in induced Ca2+ transients. The horizontal line represents the mean change in Ca2+ transients from baseline.
Figure 6
Figure 6
Changes in Ca2+ transients activated by plasma from age-related macular degeneration patients, stratified for Complement factor H (CFH) risk allele status. Plasma from patients CFH 402YH carriers vs. CFH 402HH carriers (2 different patients per risk allele status, 30 cells per patient). All patients were age-matched and had no additional Age-related maculopathy susceptibility 2 (ARMS2) risk allele. Data are mean ± SD. (A) Ca2+ transients are given as differences to the baseline in fluorescence ratio between the two excitation wavelengths 340 and 380 nm; plasma was used in concentrations of 10%. (B, C) Ca2+ transient changes at the initial peak phase and the late sustained phase. Plasma from CFH 402HH carriers induced a significantly higher change in intracellular free Ca2+ in the sustained phase compared to plasma from carriers of CFH 402YH. The horizontal line represents the mean change in Ca2+ transients from baseline. *p < 0.05 (Mann–Whitney U test).
Figure 7
Figure 7
Changes in Ca2+ transients activated by plasma from age-related macular degeneration patients, stratified for smoking status (non-smoker vs. smoker). Plasma from five different patients per group was compared, with 30 cells per patient. All patients were matched for age, age-related maculopathy susceptibility 2, and complement-factor H risk alleles. Data are mean ± SD. (A) Ca2+ transients are given as differences to the baseline in fluorescence ratio between the two excitation wavelengths 340 and 380 nm; plasma was used in concentrations of 10%. (B, C) Ca2+ transient changes at the initial peak phase and the late sustained phase. Plasma from smoking patients induced a significantly higher change in intracellular free Ca2+ in the sustained phase compared to plasma from non-smoking patients. The horizontal line represents the mean change in Ca2+ transients from baseline. **p < 0.01 (Mann–Whitney U test).
Figure 8
Figure 8
Effects of pre-stimulation with either plasma from age-related macular degeneration patients or controls on Ca2+ transients in ARPE-19 cells. The experimental conditions were pre-incubation with serum-free media (A–D), media with 10% patients’ (pts.) plasma (A, B, E, F), or media with 10% normal human plasma (NHP; C–F) for 24 h. Data are mean ± SD. (A, C) Ca2+ transients are given as differences to the baseline in the fluorescence ratio between the two excitation wavelengths 340 and 380 nm. (B, D) Ca2+ transient changes at the initial peak phase and the late sustained phase. Cells, pre-stimulated with patients’ plasma, showed a significantly higher change in intracellular free Ca2+ compared to non-pre-stimulated cells (B). Cells pre-stimulated with NHP showed a significantly higher change in intracellular free Ca2+ at the initial peak phase but a significantly lower amplitude in the sustained late phase compared to non-pre-stimulated cells (D). The horizontal line represents the mean change in Ca2+ transients from baseline. ***p < 0.001 (Mann–Whitney U test). The dataset for “non-prestimulated” for “peak” and “sustained” were statistically tested two times: Once against “pre-stimulation patients’ plasma” and a second time against “pre-stimulated NHP”; thus, the data for “non-stimulated” “peak” and “sustained” in the (B, D) are identical.
Figure 9
Figure 9
Direct comparison of pre-stimulation effects between patients’ plasma and control plasma on Ca2+ transients in ARPE-19 cells. (A) Ca2+ transients are given as differences to the baseline in the fluorescence ratio between the two excitation wavelengths 340 and 380 nm; plasma was used in concentrations of 10%. Data are mean ± SD. (B) Compared to pre-stimulation with normal human plasma (NHP), cells showed a significantly higher change in intracellular free Ca2+ in the sustained phase after pre-stimulation with patients’ plasma. The horizontal line represents the mean change in Ca2+ transients from baseline. ***p < 0.001 (Mann–Whitney U test).
Figure 10
Figure 10
Effects of patients’ plasma on differential gene expression of complement genes in ARPE-19 cells. Effect of patients’ plasma ± nifedipine (A) and serum-free media (B) and plasma compared to normal human plasma (NHP; 10%) on gene expression of C3, C3aR, C5, C5aR, CD46, CD55, CD59, complement factor H (CFH), and interleukin-1beta (IL-1β) in ARPE-19 cells. NHP and patients’ plasma were applied at a total concentration of 10% with nifedipine at 10 µM for 24 h. Data are expressed as mean values + SD. For serum-free media, n = 2–3. For patients’ plasma, n = 16, except for C5aR, n = 6. Patients’ plasma + nifedipine, n = 9, except for C5aR, n = 5. For NHP, n = 3. *p < 0.05, **p < 0.01, ***p < 0.001 (Student’s t-test).
Figure 11
Figure 11
Effects of plasma on differential secretion activities of ARPE-19 cells. Cytokine and chemokine secretion of ARPE-19 cell lines. (A, C) ARPE-19 in passage 25. (B, D) ARPE-19 in passage 15. (A–D) Plasma (all 10%) from non-smoking (NS) or smoking (S) age-related macular degeneration (AMD) patients, carriers CFH 402HH versus carriers CFH 402YH. Plasma samples with or without PI3K-inhibitor LY294002 (50 µM) were incubated with ARPE-19 cells and cyto-/chemokine concentrations determined from culture supernatants. n = 2–4 for CHF mutant plasma (* = p< 0.05 for all respective values of supernatants from cultures with inhibitor vs. without).

Similar articles

Cited by

References

    1. van Leeuwen R, Klaver CC, Vingerling JR, Hofman A, De Jong PT. Epidemiology of age-related maculopathy: a review. Eur J Epidemiol (2003) 18:845–54. doi: 10.1023/A:1025643303914 - DOI - PubMed
    1. Campochiaro PA. Ocular neovascularization. J Mol Med (Berl) (2013) 91:311–21. doi: 10.1007/s00109-013-0993-5 - DOI - PMC - PubMed
    1. Zipfel PF, Lauer N, Skerka C. The role of complement in AMD. Adv Exp Med Biol (2010) 703:9–24. doi: 10.1007/978-1-4419-5635-4_2 - DOI - PubMed
    1. Armstrong RA, Mousavi M. Overview of risk factors for age-related macular degeneration (AMD). J Stem Cells (2015) 10:171–91. - PubMed
    1. Tan PL, Bowes Rickman C, Katsanis N. AMD And the alternative complement pathway: genetics and functional implications. Hum Genomics (2016) 10:23. doi: 10.1186/s40246-016-0079-x - DOI - PMC - PubMed

Publication types