. 2023 Jun 14;3(1):vbad078.
doi: 10.1093/bioadv/vbad078. eCollection 2023.

Improvement of protein tertiary and quaternary structure predictions using the ReFOLD refinement method and the AlphaFold2 recycling process

Affiliations

Improvement of protein tertiary and quaternary structure predictions using the ReFOLD refinement method and the AlphaFold2 recycling process

Recep Adiyaman et al. Bioinform Adv. .

Abstract

Motivation: The accuracy gap between predicted and experimental structures has been significantly reduced following the development of AlphaFold2 (AF2). However, for many targets, AF2 models still have room for improvement. In previous CASP experiments, highly computationally intensive MD simulation-based methods have been widely used to improve the accuracy of single 3D models. Here, our ReFOLD pipeline was adapted to refine AF2 predictions while maintaining high model accuracy at a modest computational cost. Furthermore, the AF2 recycling process was utilized to improve 3D models by using them as custom template inputs for tertiary and quaternary structure predictions.

Results: According to the Molprobity score, 94% of the generated 3D models by ReFOLD were improved. AF2 recycling showed an improvement rate of 87.5% (using MSAs) and 81.25% (using single sequences) for monomeric AF2 models and 100% (MSA) and 97.8% (single sequence) for monomeric non-AF2 models, as measured by the average change in lDDT. By the same measure, the recycling of multimeric models showed an improvement rate of as much as 80% for AF2-Multimer (AF2M) models and 94% for non-AF2M models.

Availability and implementation: Refinement using AlphaFold2-Multimer recycling is available as part of the MultiFOLD docker package (https://hub.docker.com/r/mcguffin/multifold). The ReFOLD server is available at https://www.reading.ac.uk/bioinf/ReFOLD/ and the modified scripts can be downloaded from https://www.reading.ac.uk/bioinf/downloads/.

Supplementary information: Supplementary data are available at Bioinformatics Advances online.


Conflict of interest statement

None declared.

Figures

Figure 1.
Figure 1.
Scatter plots showing the comparison in observed lDDT scores (A) and observed TM-scores (B) between baseline models (x-axis) and models from all recycles (y-axis) for all AF2 and non-AF2 models coloured by group (MSA mode recycling)
Figure 2.
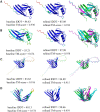
Figure 2.
Comparison of monomer models. Images in the left columns show the baseline models coloured by plDDT score. The middle columns show the refined models coloured by plDDT score. The right columns show the superposition of the baseline models (cyan), the refined models (magenta) and the native structures (green). (A) AF2 model for T1049: baseline lDDT = 84.83, TM-score = 0.930; refined lDDT = 85.08, TM-score = 0.936. (B) Zhang group model for T1049: baseline lDDT = 55.21, TM-score = 0.674; refined lDDT = 87.08, TM-score = 0.938. (C) AF2 model for T1074: baseline lDDT = 83.62, TM-score = 0.916; refined lDDT = 84.09, TM-score = 0.915. (D) Baker group model for T1074: baseline lDDT = 49.13, TM-score = 0.576; refined lDDT = 90.66, TM-score = 0.959. Images were rendered using PyMOL
Figure 3.
Figure 3.
Scatter plots showing the comparison in observed oligo-lDDT (A), observed TM (B) and observed QS scores (C) between baseline (x-axis) and all recycles (y-axis) for all AF2M and non-AF2M models (MSA mode recycling)
Figure 4.
Figure 4.
Comparison of multimeric models. Images in the left columns show the starting models coloured by plDDT score. The middle columns show the refined models coloured by plDDT score. The right columns show the superposition of starting models (cyan), the best-refined models generated by colabfold (magenta) and the observed models (green). (A) AF2M model for T1078: baseline lDDT = 0.72, TM-score = 0.60, QS score = 0.02; refined lDDT = 0.88, TM-score = 0.97, QS score = 0.84. (B) Baker group model for H1045: baseline lDDT = 0.69, TM-score = 0.87, QS score = 0.55; refined lDDT = 0.84, TM-score = 0.92, QS score = 0.97. (C) Venclovas group model for H1045: baseline lDDT = 0.54, TM-score = 0.72, QS score = 0.84; refined lDDT = 0.88, TM-score = 0.95, QS score = 0.98. Images were rendered using PyMOL

References

    1. Adiyaman R., McGuffin L.J. (2019) Methods for the refinement of protein structure 3D models. IJMS, 20, 2301. - PMC - PubMed
    1. Adiyaman R., McGuffin L.J. (2021) ReFOLD3: refinement of 3D protein models with gradual restraints based on predicted local quality and residue contacts. Nucleic Acids Res., 49, W589–W596. - PMC - PubMed
    1. Arantes P.R. et al. (2021) Making it rain: cloud-based molecular simulations for everyone. J. Chem. Inf. Model., 61, 4852–4856. - PubMed
    1. Baek M. et al. (2021) Protein oligomer modeling guided by predicted interchain contacts in CASP14. Proteins Struct. Funct. Bioinf., 89, 1824–1833. - PMC - PubMed
    1. Bertoni M. et al. (2017) Modeling protein quaternary structure of homo- and hetero-oligomers beyond binary interactions by homology. Sci. Rep., 7, 10480. - PMC - PubMed