

Circular RNA circBNC2 facilitates glycolysis and stemness of hepatocellular carcinoma through the miR-217/high mobility group AT-hook 2 (HMGA2) axis
- PMID: 37360090
- PMCID: PMC10285170
- DOI: 10.1016/j.heliyon.2023.e17120
Circular RNA circBNC2 facilitates glycolysis and stemness of hepatocellular carcinoma through the miR-217/high mobility group AT-hook 2 (HMGA2) axis
Abstract
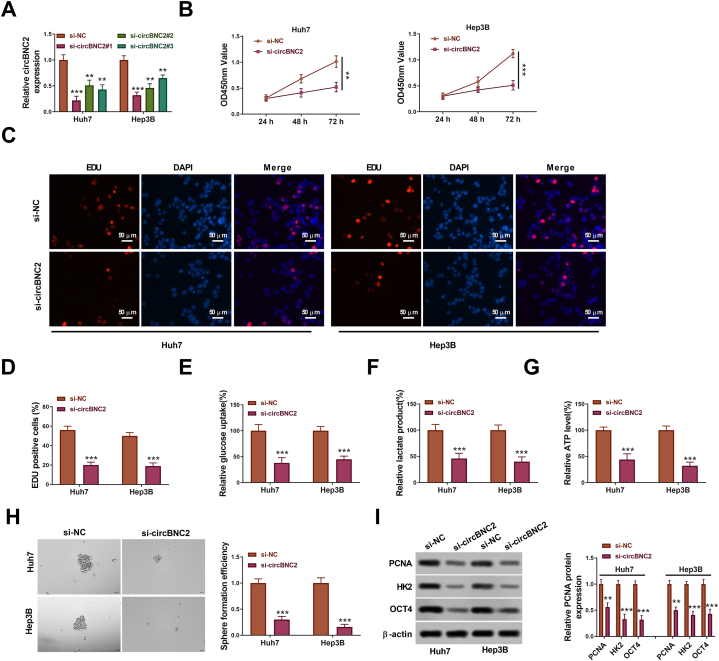
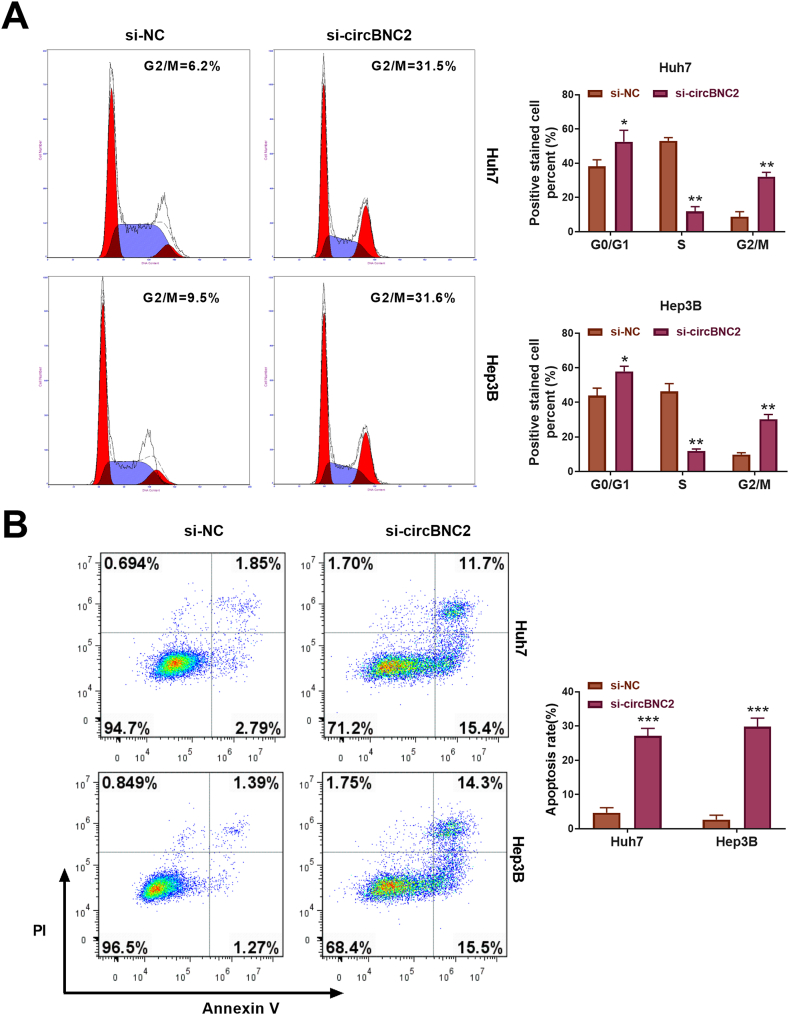
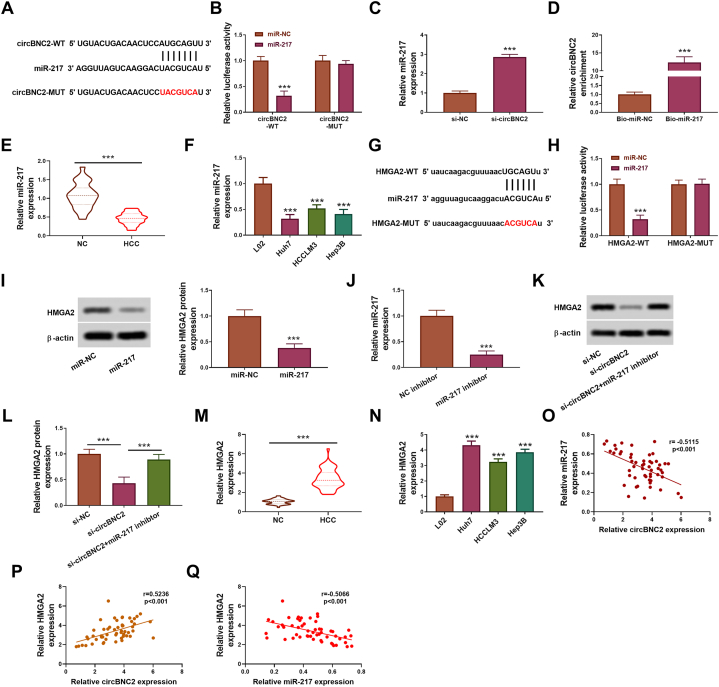
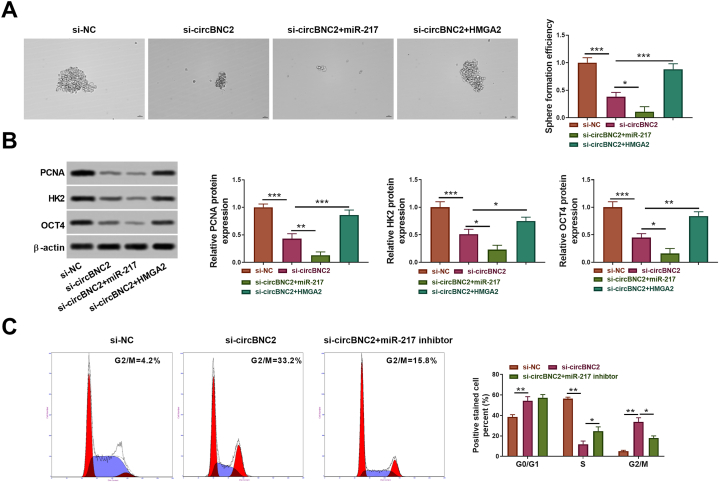
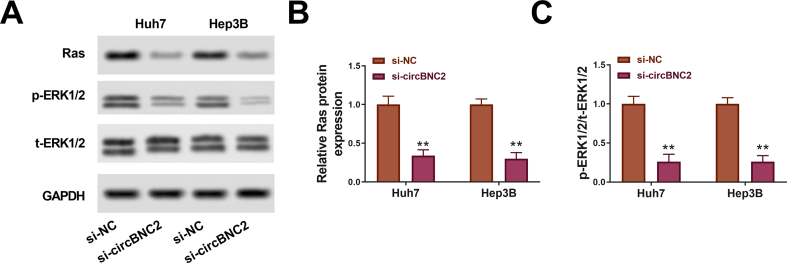
Hepatocellular cancer (HCC) accounts for approximately 90% of primary liver carcinoma and is a significant health threat worldwide. Circular RNA basonuclin 2 (circBNC2) is implicated with the progression of several cancers. However, its roles in carcinogenesis and glycolysis are still unclear in HCC. In this study, the levels of circBNC2 and high mobility group AT-hook 2 (HMGA2) were highly expressed, while these of miR-217 were poorly expressed in HCC tissues and cells. Upregulation of circBNC2 was related to poor prognosis and tumor node metastasis (TNM) stage. Knockdown of circBNC2 inhibited the HCC progression. Moreover, knockdown of circBNC2 suppressed the levels of Ras, ERK1/2, PCNA, HK2, and OCT4. Notably, circBNC2 functioned as a molecular sponge of microRNA 217 (miR-217) to upregulate the HMGA2 expression. The inhibitory effects of the circBNC2 silence on the growth and stemness of HCC cells, and levels of PCNA, HK2 and OCT4 were aggravated by the miR-217 overexpression, but neutralized by the HMGA2 overexpression. Besides, silencing of circBNC2 blocked the tumor growth through upregulating the expression of miR-217 and downregulating the levels of HMGA2, PCNA2, HK2 and OCT4 in vivo. Thus, the current data confirmed that circBNC2 sponged miR-217 to upregulate the HMGA2 level, thereby contributing to the HCC glycolysis and progression. These findings might present novel insight into the pathogenesis and treatment of HCC.
Keywords: Glycolysis; HMGA2; Hepatocellular carcinoma; circBNC2; miR-217.
© 2023 The Authors.
Conflict of interest statement
The authors declare that they have no conflict of interest.
Figures


Similar articles
-
Circular RNA circZFR Promotes Hepatocellular Carcinoma Progression by Regulating miR-375/HMGA2 Axis.Dig Dis Sci. 2021 Dec;66(12):4361-4373. doi: 10.1007/s10620-020-06805-2. Epub 2021 Jan 12. Dig Dis Sci. 2021. PMID: 33433801
-
CircRNA Circ-CCND1 Aggravates Hepatocellular Carcinoma Tumorigenesis by Regulating the miR-497-5p/HMGA2 Axis.Mol Biotechnol. 2022 Feb;64(2):178-186. doi: 10.1007/s12033-021-00391-y. Epub 2021 Sep 26. Mol Biotechnol. 2022. PMID: 34564768
-
MicroRNA-337 regulates the PI3K/AKT and Wnt/β-catenin signaling pathways to inhibit hepatocellular carcinoma progression by targeting high-mobility group AT-hook 2.Am J Cancer Res. 2018 Mar 1;8(3):405-421. eCollection 2018. Am J Cancer Res. 2018. PMID: 29636997 Free PMC article.
-
Circ-RPPH1 knockdown retards breast cancer progression via miR-328-3p-mediated suppression of HMGA2.Clin Breast Cancer. 2022 Apr;22(3):e286-e295. doi: 10.1016/j.clbc.2021.08.009. Epub 2021 Aug 31. Clin Breast Cancer. 2022. PMID: 34593318
-
Circ-CSPP1 knockdown suppresses hepatocellular carcinoma progression through miR-493-5p releasing-mediated HMGB1 downregulation.Cell Signal. 2021 Oct;86:110065. doi: 10.1016/j.cellsig.2021.110065. Epub 2021 Jun 26. Cell Signal. 2021. PMID: 34182091 Review.
Cited by
-
Sustained inactivation of the Polycomb PRC1 complex induces DNA repair defects and genomic instability in epigenetic tumors.Histochem Cell Biol. 2024 Jul;162(1-2):133-147. doi: 10.1007/s00418-024-02302-z. Epub 2024 Jun 18. Histochem Cell Biol. 2024. PMID: 38888809 Free PMC article.
-
Circular RNA circBNC2 inhibits tumorigenesis by modulating ferroptosis and acts as a nanotherapeutic target in prostate cancer.Mol Cancer. 2025 Jan 24;24(1):29. doi: 10.1186/s12943-025-02234-9. Mol Cancer. 2025. PMID: 39856701 Free PMC article.
-
Sustained inactivation of the Polycomb PRC1 complex induces DNA repair defects and genomic instability in epigenetic tumors.Res Sq [Preprint]. 2024 Apr 24:rs.3.rs-4289524. doi: 10.21203/rs.3.rs-4289524/v1. Res Sq. 2024. Update in: Histochem Cell Biol. 2024 Jul;162(1-2):133-147. doi: 10.1007/s00418-024-02302-z. PMID: 38746379 Free PMC article. Updated. Preprint.
-
circRNA6448-14/miR-455-3p/OTUB2 axis stimulates glycolysis and stemness of esophageal squamous cell carcinoma.Aging (Albany NY). 2024 May 30;16(11):9485-9497. doi: 10.18632/aging.205879. Epub 2024 May 30. Aging (Albany NY). 2024. PMID: 38819228 Free PMC article.
-
Exploring the impact of circRNAs on cancer glycolysis: Insights into tumor progression and therapeutic strategies.Noncoding RNA Res. 2024 May 5;9(3):970-994. doi: 10.1016/j.ncrna.2024.05.001. eCollection 2024 Sep. Noncoding RNA Res. 2024. PMID: 38770106 Free PMC article. Review.
References
-
- Viscardi G., Tralongo A.C., Massari F., Lambertini M., Mollica V., Rizzo A., Comito F., Di Liello R., Alfieri S., Imbimbo M., Della Corte C.M., Morgillo F., Simeon V., Lo Russo G., Proto C., Prelaj A., De Toma A., Galli G., Signorelli D., Ciardiello F., Remon J., Chaput N., Besse B., de Braud F., Garassino M.C., Torri V., Cinquini M., Ferrara R. Comparative assessment of early mortality risk upon immune checkpoint inhibitors alone or in combination with other agents across solid malignancies: a systematic review and meta-analysis. Eur. J. Cancer. 2022;177:175–185. doi: 10.1016/j.ejca.2022.09.031. - DOI - PubMed
LinkOut - more resources
Full Text Sources
Miscellaneous
