. 2023 Jun 9:17:1152563.
doi: 10.3389/fnins.2023.1152563. eCollection 2023.

Enhanced motor imagery of digits within the same hand via vibrotactile stimulation

Affiliations

Enhanced motor imagery of digits within the same hand via vibrotactile stimulation

Vadivelan Ramu et al. Front Neurosci. .

Abstract

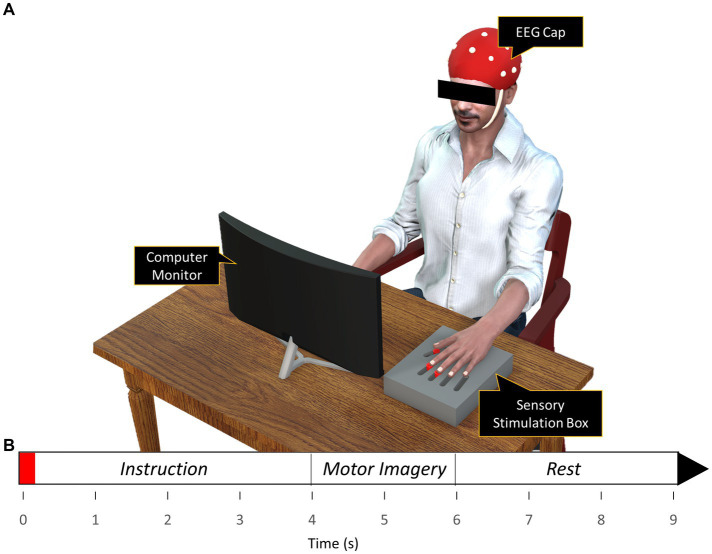
Purpose: The aim of the present study is to evaluate the effect of vibrotactile stimulation prior to repeated complex motor imagery of finger movements using the non-dominant hand on motor imagery (MI) performance.

Methods: Ten healthy right-handed adults (4 females and 6 males) participated in the study. The subjects performed motor imagery tasks with and without a brief vibrotactile sensory stimulation prior to performing motor imagery using either their left-hand index, middle, or thumb digits. Mu- and beta-band event-related desynchronization (ERD) at the sensorimotor cortex and an artificial neural network-based digit classification was evaluated.

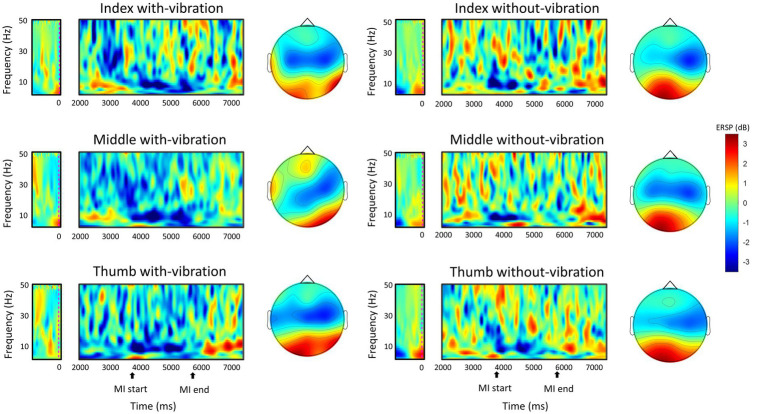
Results: The ERD and digit discrimination results from our study showed that ERD was significantly different between the vibration conditions for the index, middle, and thumb. It was also found that digit classification accuracy with-vibration (mean ± SD = 66.31 ± 3.79%) was significantly higher than without-vibration (mean ± SD = 62.68 ± 6.58%).

Conclusion: The results showed that a brief vibration was more effective at improving MI-based brain-computer interface classification of digits within a single limb through increased ERD compared to performing MI without vibrotactile stimulation.

Keywords: brain computer Interface (BCI); electroencephalography (EEG); event-related desynchronization (ERD); motor imagery; vibrotactile.


Conflict of interest statement

The authors declare that the research was conducted in the absence of any commercial or financial relationships that could be construed as a potential conflict of interest.

Figures

Figure 1
Figure 1
(A) Experimental setup (B) Timeline of the finger movement task. Subjects observed the action via the animation displayed in the computer monitor while performing motor imagery of the action displayed on the monitor. The red region on the timeline signifies the 150 ms period of vibration applied during the with-vibration condition.
Figure 2
Figure 2
The grand average ERD (mean ± SD) of all subjects for with-vibration and without-vibration in (A) Mu-band and (B) Beta-Band. A significant difference between the vibration conditions was found for the index, middle, and thumb digits for both bands (* denotes p < 0.05).
Figure 3
Figure 3
The grand-average ERSP in the time-frequency domain during motor imagery of the left-hand digits and the spatial distribution of the grand-average ERD within the mu and beta band (8–30 Hz) between 4,500 ms to 5,500 ms during the MI task period. The MI start at 4000 ms indicates the start of the animation cue of button-pushing which lasts for two seconds.
Figure 4
Figure 4
BCI-classification accuracy percentage for each subject and the average of all subjects. Error bars represent the standard deviation (SD). * denotes p < 0.05 using paired t-test.
Figure 5
Figure 5
Confusion matrix for the classification of the three digits under the with- and without-vibration conditions for each subject. The rows correspond to the output classes while the columns correspond to the target classes (Index, Middle, and Thumb for both classes). The percentage of correctly classified inputs are shown in the diagonal green boxes while the incorrectly classified entries are in the off-diagonal red boxes. The green and red boxes contain the percentage of the total number of observations that were correctly classified and misclassified, respectively. The column in the far right of the plot displays the precision or positive predictive value for all the correctly classified examples in each class. Similarly, the row at the bottom of the plot shows the percentages of correctly classified examples for each class, referred to as the recall or true positive rate. The grey box in the right end corner shows the overall classification percentage which is the sum of the diagonal entries.

References

    1. Andrade J., Cecílio J., Simões M., Sales F., Castelo-Branco M. (2017). Separability of motor imagery of the self from interpretation of motor intentions of others at the single trial level: an EEG study. J. Neuro Eng. Rehabil. 14, 1–13. doi: 10.1186/s12984-017-0276-4 - DOI - PMC - PubMed
    1. Benzy V. K., Vinod A. P., Subasree R., Alladi S., Raghavendra K. (2020). Motor imagery hand movement direction decoding using brain computer interface to aid stroke recovery and rehabilitation. IEEE Trans. Neural Syst. Rehabil. Eng. 28, 3051–3062. doi: 10.1109/TNSRE.2020.3039331, PMID: - DOI - PubMed
    1. Berends H. I., Wolkorte R., Ijzerman M. J., Van Putten M. J. A. M. (2013). Differential cortical activation during observation and observation-and-imagination. Exp. Brain Res. 229, 337–345. doi: 10.1007/s00221-013-3571-8, PMID: - DOI - PubMed
    1. Cheney P. D., Fetz E. (1984). Corticomotoneuronal cells contribute to long-latency stretch reflexes in the rhesus monkey. J. Physiol. 349, 249–272. doi: 10.1113/jphysiol.1984.sp015155, PMID: - DOI - PMC - PubMed
    1. Dahms C., Brodoehl S., Witte O. W., Klingner C. M. (2020). The importance of different learning stages for motor sequence learning after stroke. Hum. Brain Mapp. 41, 270–286. doi: 10.1002/hbm.24793, PMID: - DOI - PMC - PubMed