. 2023 Jun 17:2023:6829931.
doi: 10.1155/2023/6829931. eCollection 2023.

Improvement of Antioxidant Defences in Keratinocytes Grown in Physioxia: Comparison of 2D and 3D Models

Affiliations

Improvement of Antioxidant Defences in Keratinocytes Grown in Physioxia: Comparison of 2D and 3D Models

Nadira Chettouh-Hammas et al. Oxid Med Cell Longev. .

Abstract

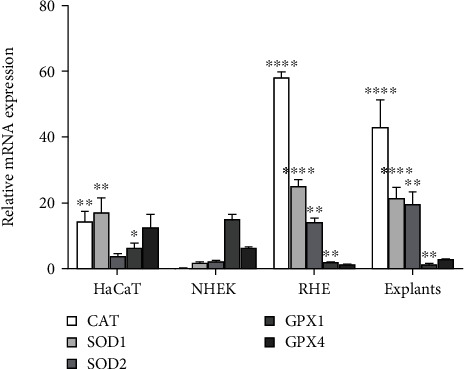
Keratinocytes prevent skin photoaging by ensuring the defence against oxidative stress, an excessive production of reactive oxygen species (ROS). They are localized within the epidermis where the oxygen level (1-3% O2), named physioxia, is low compared to other organs. Oxygen is essential for life but also generates ROS. Most of the in vitro studies on keratinocyte antioxidant capacities are performed under atmospheric oxygen, named normoxia, which is very far from the physiological microenvironment, thus submitting cells to an overoxygenation. The present study is aimed at investigating the antioxidant status of keratinocyte grown under physioxia in both 2D and 3D models. First, we show that the basal antioxidant profiles of keratinocytes display important differences when comparing the HaCaT cell line, primary keratinocytes (NHEK), reconstructed epidermis (RHE), and skin explants. Physioxia was shown to promote a strong proliferation of keratinocytes in monolayers and in RHE, resulting in a thinner epidermis likely due to a slowdown in cell differentiation. Interestingly, cells in physioxia exhibited a lower ROS production upon stress, suggesting a better protection against oxidative stress. To understand this effect, we studied the antioxidant enzymes and reported a lower or equivalent level of mRNA for all enzymes in physioxia conditions compared to normoxia, but a higher activity for catalase and superoxide dismutases, whatever the culture model. The unchanged catalase amount, in NHEK and RHE, suggests an overactivation of the enzyme in physioxia, whereas the higher amount of SOD2 can explain the strong activity. Taken together, our results demonstrate the role of oxygen in the regulation of the antioxidant defences in keratinocytes, topic of particular importance for studying skin aging. Additionally, the present work points out the interest of the choice of both the keratinocyte culture model and the oxygen level to be as close as possible to the in situ skin.


Conflict of interest statement

The authors declare that they have no competing interest.

Figures

Figure 1
Figure 1
The antioxidant expression profiles are different between HaCaT, NHEK, RHE, and skin explants. HaCaT cells, NHEK, and RHE in normoxia and skin explants were analysed for the expression of mRNA of antioxidant enzymes. The results are expressed as normalized relative mRNA expression (mean ± SEM) for catalase, superoxide dismutases 1 and 2, and glutathione peroxidases 1 and 4 (N = 3 for HaCaT, NHEK, and explants and N = 6 for RHE). Statistical significance was determined using analysis of variance (ANOVA), comparing each mRNA expression in NHEK to their expression in other models. p < 0.05, ∗∗p < 0.01, ∗∗∗p < 0.001, and ∗∗∗∗p < 0.0001. There is no statistical difference for each mRNA expression when comparing RHE and skin explant.
Figure 2
Figure 2
Differences in HaCaT and NHEK proliferation rates in physioxia vs. normoxia. HaCaT and NHEK were maintained either in physioxia (3% O2) or in normoxia (18.6% O2) for one week. (a) Phase contrast images of HaCaT and NHEK cultures at four days after seeding, scale bar: 400 μm. (b) Proliferation curves of HaCaT and NHEK in physioxia and in normoxia. Cells were quantified using the NucleoCounter® allowing the evaluation of viable cells. Data are represented with mean ± SEM of 2 independent experiments including 6 replicates each. Statistical significance was determined using analysis of variance (ANOVA). p < 0.05, ∗∗p < 0.01, ∗∗∗p < 0.001, and ∗∗∗∗p < 0.0001.
Figure 3
Figure 3
Comparison between RHE generated in physioxia and in normoxia. RHE was prepared in physioxia (3% O2) and in normoxia (18.6% O2). (a) Nucleus staining with bisbenzimide; (b) evaluation of epidermis thickness; (c) visualization of proliferative cells by Ki67 immunostaining; (d) evaluation of the percentage of Ki67-positive cells in the basal layer of RHE; (e) differentiation markers, involucrin and loricrin, immunostaining. Scale bar: 50 μm. Data are represented with mean ± SEM of at least 3 independent experiments. Statistical significance was determined using analysis of variance (ANOVA). p < 0.05 and ∗∗p < 0.01.
Figure 4
Figure 4
Decrease in H2O2-induced ROS production in keratinocytes under physioxia condition. HaCaT and NHEK, in physioxia or in normoxia, were submitted to H2O2 stress (50 to 400 μM) for 20 min. ROS production was evaluated using the CM-H2DCFDA probe. Nontreated (NT) cells were incubated with N-acetyl-cysteine (NAC, 5 mM), a ROS scavenger. Basal ROS production was expressed as normalized values versus normoxia condition. H2O2-stimulated ROS production was expressed as normalized values versus the corresponding control, normoxia or physioxia. Data are represented with mean ± SEM of at least 3 independent experiments. Statistical significance was determined using analysis of variance (ANOVA). ##p < 0.01 and ####p < 0.0001 versus the corresponding control, physioxia or normoxia. p < 0.05, ∗∗p < 0.01, ∗∗∗p < 0.001, and ∗∗∗∗p < 0.0001 between physioxia and normoxia.
Figure 5
Figure 5
Physioxia decreases antioxidant gene expression in keratinocyte cultures, HaCaT (a), NHEK (b), and RHE (c). HaCaT and NHEK were grown in physioxia (3% O2) or normoxia (18.6% O2) for 4 days. RHE were generated in physioxia or in normoxia for 15 days. Quantitative real-time PCR analyses were performed for mRNA expression of catalase, SOD1, SOD2, GPX1, and GPX4. The results were normalized to the three housekeeping genes GAPDH, B2M, and GUSB. Data are represented by the relative mRNA expression with mean ± SEM of at least 3 independent experiments. Statistical significance was determined using analysis of variance (ANOVA). p < 0.05, ∗∗p < 0.01, ∗∗∗p < 0.001, and ∗∗∗∗p < 0.0001 between physioxia and normoxia.
Figure 6
Figure 6
Physioxia modulates antioxidant enzyme amounts in keratinocyte cultures. HaCaT and NHEK were submitted to physioxia (3% O2) or normoxia (18.6% O2) for 4 days. The catalase, SOD1, SOD2, GPX1, and GPX4 were visualized by red immunofluorescence with a counterstain of nuclei with bisbenzimide in HaCaT (a) and in NHEK (b). Scale bar: 40 μm. Western blotting pictures and quantification of catalase, SOD1, SOD2, and GPX4 in HaCaT (c) and in NHEK (d). Data are represented by the relative protein amount with mean ± SEM of at least 3 independent experiments. Statistical significance was determined using analysis of variance (ANOVA). p < 0.05 and ∗∗p < 0.01, between physioxia and normoxia.
Figure 7
Figure 7
Physioxia modulates antioxidant enzyme amounts in RHE. RHE were generated in physioxia (3% O2) or in normoxia (18.6% O2) for 15 days. (a) Catalase, SOD1, and SOD2 were visualized by red immunofluorescence with a counterstain of nuclei with bisbenzimide. Scale bar: 50 μm. (b) Quantification of catalase, SOD1, and SOD2 from immunostainings. Data are represented by the relative protein amount with mean ± SEM of at least 3 independent experiments. Statistical significance was determined using analysis of variance (ANOVA). p < 0.05 and ∗∗p < 0.01, between physioxia and normoxia.
Figure 8
Figure 8
Physioxia stimulates antioxidant enzyme activity in keratinocyte cultures and in RHE. HaCaT and NHEK were submitted to physioxia (3% O2) or normoxia (18.6% O2) for 4 days. RHE were generated in physioxia (3% O2) or in normoxia (18.6% O2) for 15 days. Catalase and SOD enzymatic activities were evaluated in cells or RHE extracts. Data are presented by the relative enzymatic activities, normalized to protein amount, with mean ± SEM of at least 3 independent experiments. Statistical significance was determined using analysis of variance (ANOVA). p < 0.05, ∗∗p < 0.01, ∗∗∗p < 0.001, and ∗∗∗∗p < 0.0001 between physioxia and normoxia.

Similar articles

Cited by

References

    1. Carreau A., El Hafny-Rahbi B., Matejuk A., Grillon C., Kieda C. Why is the partial oxygen pressure of human tissues a crucial parameter? Small molecules and hypoxia. Journal of Cellular and Molecular Medicine . 2011;15(6):1239–1253. doi: 10.1111/j.1582-4934.2011.01258.x. - DOI - PMC - PubMed
    1. Wenger R. H., Kurtcuoglu V., Scholz C. C., Marti H. H., Hoogewijs D. Frequently asked questions in hypoxia research. Hypoxia . 2015;3:35–43. doi: 10.2147/HP.S92198. - DOI - PMC - PubMed
    1. Shih C.-P., Lee J.-T., Chen H.-K., et al. Comparison of changes in mitochondrial bioenergetics between keratinocytes in human external auditory canal skin and cholesteatomas from normoxia to hypoxia. Scientific Reports . 2018;8(1):p. 125. doi: 10.1038/s41598-017-18536-y. - DOI - PMC - PubMed
    1. Kato H., Sugimoto M., Enomoto A., et al. Metabolomic alteration of oral keratinocytes and fibroblasts in hypoxia. Journal of Clinical Medicine . 2021;10(6):p. 1156. doi: 10.3390/jcm10061156. - DOI - PMC - PubMed
    1. Kato H., Izumi K., Uenoyama A., Shiomi A., Kuo S., Feinberg S. E. Hypoxia induces an undifferentiated phenotype of oral keratinocytes in vitro. Cells, Tissues, Organs . 2015;199(5-6):393–404. doi: 10.1159/000371342. - DOI - PMC - PubMed

MeSH terms