. 2023 Jun 8;26(7):107047.
doi: 10.1016/j.isci.2023.107047. eCollection 2023 Jul 21.

Toward countering muscle and bone loss with spaceflight: GSK3 as a potential target

Affiliations

Toward countering muscle and bone loss with spaceflight: GSK3 as a potential target

Ryan W Baranowski et al. iScience. .

Abstract

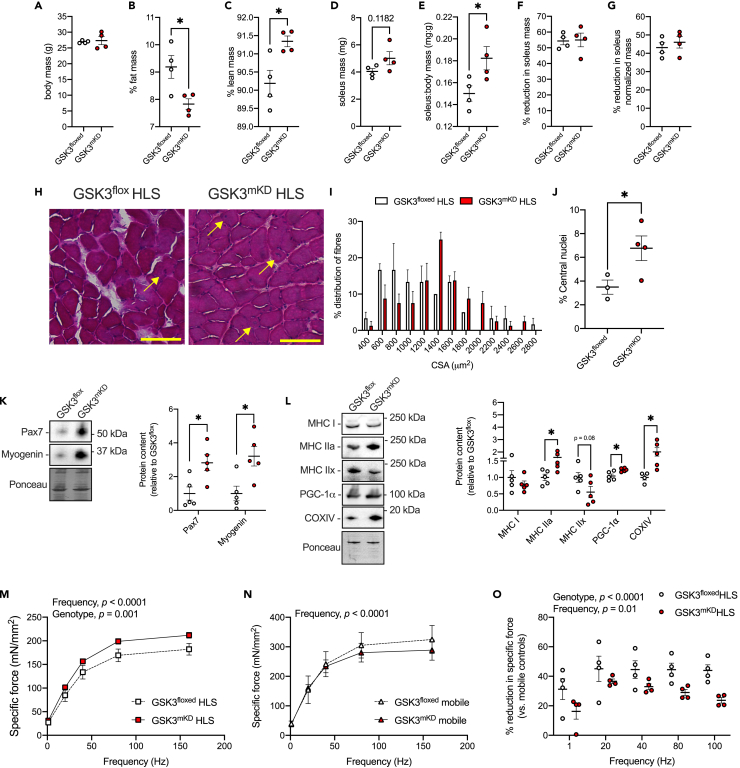
We examined the effects of ∼30 days of spaceflight on glycogen synthase kinase 3 (GSK3) content and inhibitory serine phosphorylation in murine muscle and bone samples from four separate missions (BION-M1, rodent research [RR]1, RR9, and RR18). Spaceflight reduced GSK3β content across all missions, whereas its serine phosphorylation was elevated with RR18 and BION-M1. The reduction in GSK3β was linked to the reduction in type IIA fibers commonly observed with spaceflight as these fibers are particularly enriched with GSK3. We then tested the effects of inhibiting GSK3 before this fiber type shift, and we demonstrate that muscle-specific Gsk3 knockdown increased muscle mass, preserved muscle strength, and promoted the oxidative fiber type with Earth-based hindlimb unloading. In bone, GSK3 activation was enhanced after spaceflight; and strikingly, muscle-specific Gsk3 deletion increased bone mineral density in response to hindlimb unloading. Thus, future studies should test the effects of GSK3 inhibition during spaceflight.

Keywords: Musculoskeletal medicine; Space medicine.


Conflict of interest statement

The authors declare no competing interests.

Figures

None
Graphical abstract
Figure 1
Figure 1
The combined effect of spaceflight across all missions on GSK3 content, phosphorylation status and MHC isoform content in soleus muscles (A) Total GSK3β content. (B) Phosphorylated GSK3β (Ser9) relative to total GSK3β content. (C) Total GSK3α content. (D) Phosphorylated GSK3α (Ser21) relative to total GSK3β content. (E) MHC I content. (F) MHC IIa content. (G) MHC IIx content. (H) MHC IIb content. Fold-change (FC) data were calculated for each mission by dividing the Flight group by the average of the combined GC and VIV groups. The combined dataset represents the mean ± SEM and p value (Student’s t test) for all FC data (RR1, RR9, RR18, and BION-M1).
Figure 2
Figure 2
Serial cryosections showing type IIA fiber enrichment of GSK3β (A) Serial 10 μm sections for MHC isoforms (I, blue; IIa, green; IIx, unstained black; and IIb, red) and GSK3β in the soleus. (B) Quantitative comparison of GSK3β across type I, IIA, and IIX fibers in the soleus. Data are expressed relative to type I fibers. (C) Serial 10 μm sections for MHC isoforms (IIa, green; IIx, unstained black; and IIb, red) and GSK3β in the EDL. (D) Quantitative comparison of GSK3β across type IIA, IIX, and IIB fibers in the EDL. Data are expressed relative to type IIB fibers. ∗p < 0.05, ∗∗p < 0.01, ∗∗∗p < 0.001, ∗∗∗∗p < 0.0001, using a one-way ANOVA and a Tukey’s post-hoc test (n = 30 fibers analyzed per group from 3 separate mice). Scale bars are set to 200 μm.
Figure 3
Figure 3
Partial muscle-specific Gsk3 knockdown (GSK3mKD) increases soleus muscle mass, myogenic signaling, and the oxidative phenotype while preserving muscle strength after 7 days of hindlimb suspension (HLS) (A–C) DXA scan analyses showing that GSK3mKD mice have no change in body mass but have lowered % fat mass and increased % lean mass even after 7 days of HLS. (D and E) Absolute and relative (to body mass) soleus muscle weights. (F and G) Percent reduction of absolute and relative soleus muscle weights in GSK3mKD and GSK3flox mice when compared to their respective mobile controls (see Figure S10). (H–J) H&E staining in the soleus shows that GSK3mKD mice have an increased distribution of larger fibers versus GSK3flox mice (rightward shift) and increased centrally located nuclei (see yellow arrows). Scale bars are set to 200 μm; CSA, cross-sectional area. (K) Western blot analysis of myogenic markers Pax7 and myogenin. (L) Western blot analysis of oxidative phenotype markers, MHC I, MHC IIa, PGC-1α, and COXIV as well as the glycolytic MHC IIx. (M) Specific force-frequency curves in soleus muscles from GSK3mKD and GSK3flox control mice after 7 days of HLS. (N) Specific force-frequency curves in soleus muscles from mobile GSK3mKD and GSK3flox control mice. (O) Calculated percent reduction in specific force across stimulation frequencies from GSK3mKD and GSK3flox control mice after 7 days of HLS (compared to their respective mobile controls). For (B, C, E, J, K, L), ∗p < 0.05 using a Student’s t test. For (N-O), a two-way ANOVA was used to test the main effects of genotype and frequency. Data are presented as means ± SEM.
Figure 4
Figure 4
GSK3β phosphorylation and content in femur samples obtained from male RR9 mice (A and B) Bone mineral content (BMC) and bone mineral density (BMD) of the individual bones obtained from a small animal DXA scanner. (C) Representative western blot images of phosphorylated (Ser9) and total GSK3β. (D and E) Western blot analysis of phosphorylated (Ser9) and total GSK3β content normalized to ponceau. (F) GSK3 activation status measured as the ratio of phosphorylated (Ser9) GSK3β relative to total GSK3β. (G) Representative DXA scan showing region-specific analysis of the femur, tibia, and lumbar spine in mice. (H) Region-specific BMD analysis in mobile GSK3mKD and GSK3flox mice measured at baseline. (I) Region-specific BMD analysis in mobile GSK3mKD and GSK3flox mice measured after 7 days of HLS. (J) Western blot analysis of soleus muscle FNDC5 from GSK3mKD and GSK3flox mice measured after 7 days of HLS. (K) Proposed tissue crosstalk between muscle and bone with muscle-specific Gsk3 deletion leading to an increase in FNDC5 and tibia BMD. ∗p < 0.05, ∗∗∗p < 0.001 using a Student’s t test (n = 6–12 per group for (A–F); n = 3–5 per group for (H–J). For (A–F), GC and VIV controls were combined to increase statistical power. All values are presented as means ± SEM.

References

    1. Patel Z.S., Brunstetter T.J., Tarver W.J., Whitmire A.M., Zwart S.R., Smith S.M., Huff J.L. Red risks for a journey to the red planet: the highest priority human health risks for a mission to Mars. npj Microgravity. 2020;6:33. doi: 10.1038/s41526-020-00124-6. - DOI - PMC - PubMed
    1. Gillespie J.R., Bush J.R., Bell G.I., Aubrey L.A., Dupuis H., Ferron M., Kream B., DiMattia G., Patel S., Woodgett J.R., et al. GSK-3β function in bone regulates skeletal development, whole-body metabolism, and male life span. Endocrinology. 2013;154:3702–3718. doi: 10.1210/en.2013-1155. - DOI - PMC - PubMed
    1. Woodgett J.R. Molecular cloning and expression of glycogen synthase kinase-3/factor A. EMBO J. 1990;9:2431–2438. doi: 10.1002/j.1460-2075.1990.tb07419.x. - DOI - PMC - PubMed
    1. Liang M.H., Chuang D.M. Differential roles of glycogen synthase kinase-3 isoforms in the regulation of transcriptional activation. J. Biol. Chem. 2006;281:30479–30484. doi: 10.1074/jbc.M607468200. - DOI - PubMed
    1. Kerkela R., Kockeritz L., Macaulay K., Zhou J., Doble B.W., Beahm C., Greytak S., Woulfe K., Trivedi C.M., Woodgett J.R., et al. Deletion of GSK-3beta in mice leads to hypertrophic cardiomyopathy secondary to cardiomyoblast hyperproliferation. J. Clin. Invest. 2008;118:3609–3618. doi: 10.1172/jci36245. - DOI - PMC - PubMed

LinkOut - more resources