. 2023 Apr 7;5(8):100756.
doi: 10.1016/j.jhepr.2023.100756. eCollection 2023 Aug.

Saturated fatty acid-enriched small extracellular vesicles mediate a crosstalk inducing liver inflammation and hepatocyte insulin resistance

Affiliations

Saturated fatty acid-enriched small extracellular vesicles mediate a crosstalk inducing liver inflammation and hepatocyte insulin resistance

Irma Garcia-Martinez et al. JHEP Rep. .

Abstract

Background & aims: Lipotoxicity triggers non-alcoholic fatty liver disease (NAFLD) progression owing to the accumulation of toxic lipids in hepatocytes including saturated fatty acids (SFAs), which activate pro-inflammatory pathways. We investigated the impact of hepatocyte- or circulating-derived small extracellular vesicles (sEV) secreted under NAFLD conditions on liver inflammation and hepatocyte insulin signalling.

Methods: sEV released by primary mouse hepatocytes, characterised and analysed by lipidomics, were added to mouse macrophages/Kupffer cells (KC) to monitor internalisation and inflammatory responses. Insulin signalling was analysed in hepatocytes exposed to conditioned media from sEV-loaded macrophages/KC. Mice were i.v. injected sEV to study liver inflammation and insulin signalling. Circulating sEV from mice and humans with NAFLD were used to evaluate macrophage-hepatocyte crosstalk.

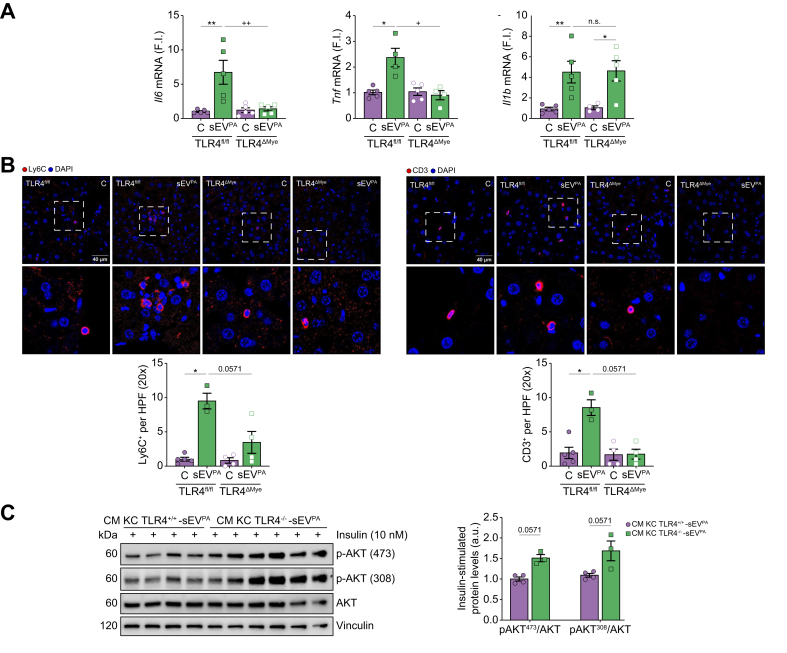
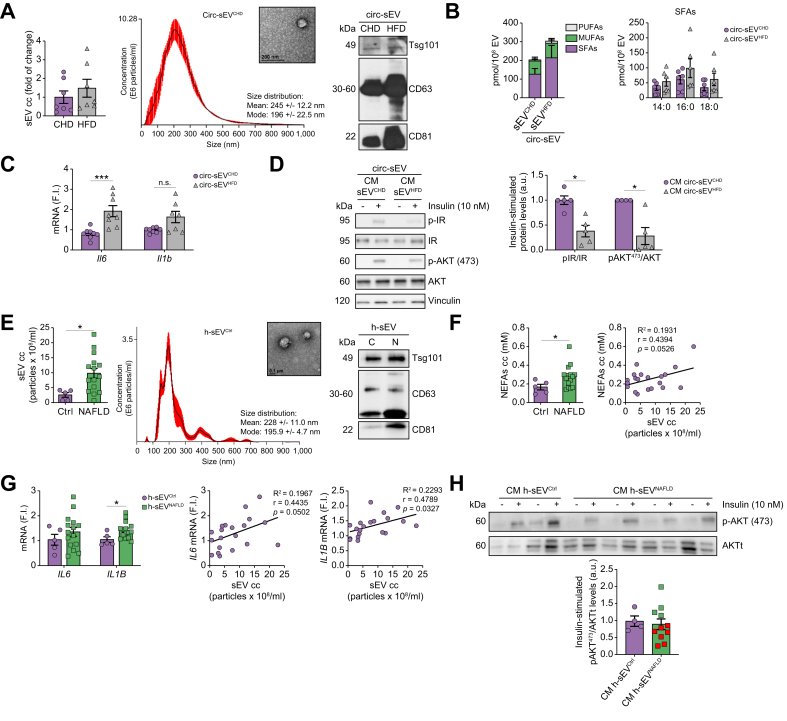
Results: Numbers of sEV released by hepatocytes increased under NAFLD conditions. Lipotoxic sEV were internalised by macrophages through the endosomal pathway and induced pro-inflammatory responses that were ameliorated by pharmacological inhibition or deletion of Toll-like receptor-4 (TLR4). Hepatocyte insulin signalling was impaired upon treatment with conditioned media from macrophages/KC loaded with lipotoxic sEV. Both hepatocyte-released lipotoxic sEV and the recipient macrophages/KC were enriched in palmitic (C16:0) and stearic (C18:0) SFAs, well-known TLR4 activators. Upon injection, lipotoxic sEV rapidly reached KC, triggering a pro-inflammatory response in the liver monitored by Jun N-terminal kinase (JNK) phosphorylation, NF-κB nuclear translocation, pro-inflammatory cytokine expression, and infiltration of immune cells into the liver parenchyma. sEV-mediated liver inflammation was attenuated by pharmacological inhibition or deletion of TLR4 in myeloid cells. Macrophage inflammation and subsequent hepatocyte insulin resistance were also induced by circulating sEV from mice and humans with NAFLD.

Conclusions: We identified hepatocyte-derived sEV as SFA transporters targeting macrophages/KC and activating a TLR4-mediated pro-inflammatory response enough to induce hepatocyte insulin resistance.

Impact and implications: Small extracellular vesicles (sEV) released by the hepatocytes under non-alcoholic fatty liver disease (NAFLD) conditions cause liver inflammation and insulin resistance in hepatocytes via paracrine hepatocyte-macrophage-hepatocyte crosstalk. We identified sEV as transporters of saturated fatty acids (SFAs) and potent lipotoxic inducers of liver inflammation. TLR4 deficiency or its pharmacological inhibition ameliorated liver inflammation induced by hepatocyte-derived lipotoxic sEV. Evidence of this macrophage-hepatocyte interactome was also found in patients with NAFLD, pointing to the relevance of sEV in SFA-mediated lipotoxicity in NAFLD.

Keywords: Extracellular vesicles; Inflammation; Insulin resistance; Lipotoxicity; NAFLD; TLR4.


Conflict of interest statement

The authors declare no conflicts of interest related to this work. Please refer to the accompanying ICMJE disclosure forms for further details.

Figures

None
Graphical abstract
Fig. 1
Fig. 1
Characterisation of the sEV released by PH under lipotoxic conditions and SFA content. (A) Quantification of sEV cc released to the culture medium by NTA (n = 8/group) (left panel). Representative NTA and TEM photomicrograph (scale bar, 100 nm) from sEVPA (middle panel). Expression of sEV markers and Calnexin in sEV (right panel). Lysates from primary hepatocytes (Lys) were used as control. (B–E) Lipidomic analysis (n = 3/group). Total FFA content chart (left panel) and bar graph (middle panel) and SFA distribution (right panel) in PH secreting sEV (B), sEV (C), rM (D), and rKC (E). Data are expressed as the mean ± SEM. ∗∗p <0.01, ∗∗∗p <0.001, compared with sEVC, Mann–Whitney U test (A). ∗p <0.05, ∗∗p <0.01, ∗∗∗p <0.001 compared with sPHC (B), sEVC (C), rM-sEVC (D), or rKC-sEVC (E), Two-way ANOVA, Bonferroni post hoc test. cc, concentration; FFA, free fatty acid; HFD, high-fat diet; MUFA, monounsaturated fatty acid; NTA, nanoparticle tracking analysis; PA, palmitic acid; PH, primary hepatocytes; PUFA, polyunsaturated fatty acid; rKC, recipient primary Kupffer cells; rM, recipient peritoneal macrophages; sEV, mall extracellular vesicles; SFA, saturated fatty acid; sPH, secreting PH; TEM, transmission electron microscopy.
Fig. 2
Fig. 2
sEV released by lipotoxic PH trigger inflammation in macrophages. (A) Western blot analysis with the indicated antibodies IκBα (n = 5–8/group), and pJNK/JNK and pP38 MAPK/P38 MAPK (n = 3–5/group), and quantification. (B) p65-NF-κB nuclear translocation by immunofluorescence (red) counterstaining with DAPI (blue) (left panel). Arrows point to p65-NF-κB-positive nuclei (scale bar, 40 μm) (right panel). Quantification of the percentage of cells with p65-NF-κB nuclear translocation (n = 5–8/group). (C) Il-6, Il-1β, Tnf, and Ccl2 mRNA levels and (D) Il-10 mRNA levels in peritoneal macrophages incubated with sEV for 8 h (n = 5–6/group). (E) IL-6 and IL-1β released to the culture supernatants by peritoneal macrophages (left panel) and IL-1β released to the culture supernatants by KC (right panel) receiving sEV for 8 h (n = 4–8/group). (F) Il-6 and Il-1β mRNA levels in peritoneal macrophages treated with 10 μg of sEVC or sEVPA for 8 h (n = 5–7/group). (G) Il-6 and Il-1β mRNA levels in peritoneal macrophages after incubation with the lipid fraction from sEV (L-sEVC, L-sEVPA, and L-sEVHFD) for 8 h (n = 4–13/group). Data are expressed as the mean ± SEM. ∗p <0.05, ∗∗p <0.01, ∗∗∗p <0.001, compared with sEVC, Mann–Whitney U test. a.u., arbitrary units; FI, fold induction; HFD, high-fat diet; JNK, Jun N-terminal kinase; KC, Kupffer cells; MAPK, mitogen-activated protein kinase; PA, palmitic acid; PH, primary hepatocytes; sEV, small extracellular vesicles.
Fig. 3
Fig. 3
CM from peritoneal macrophages and KC treated with lipotoxic sEV induces insulin resistance in PH. PH were incubated for 24 h with CM collected from peritoneal macrophages (A) or KC (B) previously treated with sEV for 24 or 8 h, respectively. Then hepatocytes were stimulated with insulin (10 nM) for a further 10 min. Phosphorylation of IR and AKT was analysed by Western blot and normalised by total IR and AKT levels. Representative Western blots and quantification are shown (n = 4–7/group). Data are expressed as the mean ± SEM. ∗p <0.05, ∗∗p <0.01, compared with CM sEVC, Mann–Whitney U test. a.u., arbitrary units; CM, conditioned medium; IR, insulin receptor; KC, Kupffer cells; PA, palmitic acid; PH, primary hepatocytes; sEV, small extracellular vesicles.
Fig. 4
Fig. 4
TLR4/NF-κB signalling pathway plays a role in macrophage/KC inflammation induced by lipotoxic sEV released by PH. (A) Representative Western blots and quantification (n = 3–4/group). (B) Tlr4 mRNA levels in peritoneal macrophages incubated with sEV for 8 h (n = 5–6/group). (C) Peritoneal macrophages from wild-type (TLR4+/+) and TLR4-/- mice were incubated with sEV for 15 min. Representative blots and quantification (n = 4–6/group). Peritoneal macrophages (D) and KC (E) from TLR4+/+ and TLR4-/- mice were incubated with sEV for 1 h. Representative images are shown (scale bar, 40 μm). Arrows point to p65-NF-κB-positive nuclei (left panel). Quantification of cells with p65-NFκB nuclear translocation (fold vs. each sEVC) (right panel) (n = 4–8/group). (F) KC from TLR4+/+ and TLR4-/- mice were incubated with sEV for 8 h. Il-6, Il-1β, and Tnf mRNA levels (n = 6–13/group). Data are expressed as the mean ± SEM. In (A), ∗p <0.05, compared with sEVC. In (C)–(F), ∗p <0.05, ∗∗p <0.01, ∗∗∗p <0.001, compared with sEVC from the same genotype, and +p <0.05, ++p <0.01, compared with the same condition in TLR4+/+ mice, Mann–Whitney U test. a.u., arbitrary units; FI, fold induction; HFD, high-fat diet; KC, Kupffer cells; PA, palmitic acid; PH, primary hepatocytes; sEV, small extracellular vesicles; TLR4, Toll-like receptor-4.
Fig. 5
Fig. 5
In vivo delivery of sEV released by lipotoxic PH targeted KC and induced a rapid inflammatory response in the liver. (A) Experimental design of in vivo sEV injection. (B) PKH26-labelled sEVPA (red) uptake by KC analysed by immunofluorescence using anti-Clec4f antibody (green) counterstaining with DAPI (blue). Representative liver images (scale bar, 40 μm) and percentage of sEV-positive liver cells and sEV-positive liver cells expressing Clec4f are shown (n = 3 sEV-injected mice). (C) Mice were i.v. injected or not TLR4 inhibitor (TLR4i) 1 h before sEV injection. Il-6, Il-1β, Tnf, and Ccl2 mRNA levels in the liver are shown (n = 3–6/mice group). (D) TLR4 levels (n = 4–5 mice/group) and JNK phosphorylation (n = 4/mice group) in livers at 2 h post sEV injection analysed by Western blot and normalised with Vinculin and JNK, respectively. Representative blots and quantification are shown. Data are expressed as the mean ± SEM. In (C) and (D), ∗p <0.05, ∗∗p <0.01, compared with sEVC and +p <0.05, ++p <0.01 compared with sEVPA, Mann–Whitney U test. a.u., arbitrary units; FI, fold induction; JNK, Jun N-terminal kinase; KC, Kupffer cells; PA, palmitic acid; PH, primary hepatocytes; sEV, small extracellular vesicles; TLR4, Toll-like receptor-4; TLR4i, TLR4 inhibitor.
Fig. 6
Fig. 6
The rapid inflammatory response induced by in vivo injection of PH-released lipotoxic sEV impairs insulin signalling in the liver. (A) Representative liver micrographs showing translocation of p65-NF-κB to the nucleus (scale bar, 50 μm) 30 min and 2 h after i.v. sEV injection. TLR4i was injected at 3 mg/kg to the corresponding group 1 h before sEV injection. Arrows point to p65-NF-κB-positive nuclei (scale bar, 50 μm). Percentage of liver cells (non-parenchymal and parenchymal) with p65-NF-κB nuclear translocation at 30 min and 2 h (n = 3–5 mice/group) are shown (lower left panel). (B) Representative micrographs of liver sections 2 h after sEV injection with the indicated antibodies. (upper panel) Ly6C-positive cells (scale bar, 100 μm) and quantification (n = 3–6 mice/group). (lower panel) CD3-positive cells (scale bar, 100 μm) and quantification (n = 3–4 mice/group). (C) KC, isolated from mice at 16 h post injection of sEV, were cultured for 16 h, and CM were collected. PH were incubated for 24 h with the CM collected from KC and then stimulated with insulin (10 nM) for 10 min. Representative Western blots of AKT phosphorylation normalised by AKT levels and quantifications (n = 3–4/mice group). Data are expressed as the mean ± SEM. In (A) and (B), ∗p <0.05 compared with sEVC, +p <0.05 compared with sEVPA, Mann–Whitney U test. a.u., arbitrary units; CM, conditioned medium; HPF, high-power field; KC, Kupffer cells; PA, palmitic acid; PH, primary hepatocytes; sEV, small extracellular vesicles; TLR4, Toll-like receptor-4; TLR4i, TLR4 inhibitor.
Fig. 7
Fig. 7
sEV-mediated liver inflammation was reduced in mice with TLR4 deletion in myeloid cells. TLR4fl/fl and TLR4ΔMye mice were injected i.v. sEVPA or PBS as control and sacrificed at 30 min or 2 h. (A) Il-6, Il-1β, and Tnf mRNA levels in the liver at 30 min post injection (n = 4–5/group). (B) Representative immunofluorescence images of liver sections 2 h after sEV injection with the indicated antibodies (n = 3–5/mice group). (upper panel) Ly6C-positive cells (scale bar, 40 μm) and quantification. (lower panel) CD3-positive cells (scale bar, 40 μm) and quantification. (C) KC, isolated from TLR4+/+ and TLR4-/- mice at 16 h post injection of sEVPA, were cultured for 16 h, and CM were collected and used to treat PH for 24 h prior to insulin stimulation (10 nM, 10 min). Representative Western blots of AKT phosphorylation normalised by AKT levels and quantifications (n = 3–4/mice group). Data are expressed as the mean ± SEM. In (A) and (B), ∗p <0.05, ∗∗p <0.01, compared with control from the same genotype, and +p <0.05, ++p <0.01, compared with sEVPA in TLR4fl/fl mice, Mann–Whitney U test. In (C) Mann–Whitney U test compared with sEVPA in TLR4+/+ mice. a.u., arbitrary units; CM, conditioned medium; FI, fold induction; HPF, high-power field; KC, Kupffer cells; PA, palmitic acid; PH, primary hepatocytes; sEV, small extracellular vesicles; TLR4, Toll-like receptor-4.
Fig. 8
Fig. 8
Circ-sEV from obese mice with NAFLD and patients with NAFLD are elevated in plasma and induce inflammation in macrophages and insulin resistance in hepatocytes. (A) NTA quantification of Circ-sEV (n = 7/group) (left panel). Representative image of NTA and TEM photomicrograph from Circ-sEVCHD (scale bar, 200 nm) (middle panel). Expression of sEV markers and calnexin in Circ-sEV (right panel). (B) Total FFA content (left) and SFA distribution (right) in Circ-sEV are shown (n = 6/group). (C) Il-6 and Il-1β mRNAs in peritoneal macrophages incubated with Circ-EV for 8 h (n = 7–8/group). (D) Peritoneal macrophages were incubated with Circ-sEVC for 24 h and the CM was used to treat PH for 24 h prior to insulin stimulation (10 min, 10 nM). Representative Western blots and quantification (n = 4–5/group). (E) NTA quantification of Circ-sEV in plasma from healthy individuals (Ctrl, n = 5) and patients with NAFLD (NAFLD, n = 15) (left panel). Representative image of NTA and TEM photomicrograph (scale bar, 0.1 μm) from healthy h-sEVCtrl (middle panel). Expression of sEV markers in h-sEV (right panel). (F) Quantification of circulating NEFAs (left panel) in healthy individuals (Ctrl, n = 5) and patients with NAFLD (NAFLD, n = 15). Correlation between the amount of sEV and NEFAs in plasma (right panel). (G) h-MFs were incubated for 8 h with h-sEVCtrl or h-sEVNAFLD. IL-6 and IL-1β (beta) mRNAs (left panel). Correlation between the amount of sEV in plasma and IL-6 and IL-1β (beta) mRNAs in h-MFs treated with the sEV (middle and right panels, respectively). (H) h-MFs were incubated for 24 h with sEV from plasma of control individuals or patients with NAFLD. The CM was used to treat HuH7 human hepatocytes for 24 h before insulin stimulation (10 min, 10 nM). Representative Western blots and quantification (Ctlr, n = 4; patients with NAFLD, n = 11). Data are expressed as the mean ± SEM. In (C) and (D), ∗p <0.05, ∗∗∗p <0.001, compared with Circ-sEVCHD, Mann–Whitney U test. In (E–G), ∗p <0.05, compared with h-sEVCtrl, Mann–Whitney U test. a.u., arbitrary units; cc, concentration; CHD, chow diet; Circ-sEV, circulating sEV; CM, conditioned medium; FI, fold induction; FFA, free fatty acid; h-MF, human macrophage; HFD, high-fat diet; IR, insulin receptor; MUFA, monounsaturated fatty acid; NAFLD, non-alcoholic fatty liver disease; NEFA, non-esterified fatty acid; NTA, nanoparticle tracking analysis; PUFA, polyunsaturated fatty acid; sEV, small extracellular vesicles; SFA, saturated fatty acid; TEM, transmission electron microscopy.

References

    1. Younossi Z.M., Koenig A.B., Abdelatif D., Fazel Y., Henry L., Wymer M. Global epidemiology of nonalcoholic fatty liver disease-Meta-analytic assessment of prevalence, incidence, and outcomes. Hepatology. 2016;64:73–84. - PubMed
    1. Banini B.A., Sanyal A.J. Nonalcoholic Fatty liver disease: epidemiology, pathogenesis, natural history, diagnosis, and current treatment options. Clin Med Insights Ther. 2016;8:75–84. - PMC - PubMed
    1. Eslam M., Newsome P.N., Sarin S.K., Anstee Q.M., Targher G., Romero-Gomez M., et al. A new definition for metabolic dysfunction-associated fatty liver disease: an international expert consensus statement. J Hepatol. 2020;73:202–209. - PubMed
    1. Adams L.A., Ratziu V. Non-alcoholic fatty liver – perhaps not so benign. J Hepatol. 2015;62:1002–1004. - PubMed
    1. Béland-Bonenfant S., Rouland A., Petit J.M., Vergès B. Concise review of lipidomics in nonalcoholic fatty liver disease. Diabetes Metab. 2023;49 - PubMed