

Tumor subtypes and signature model construction based on chromatin regulators for better prediction of prognosis in uveal melanoma
- PMID: 37362244
- PMCID: PMC10287976
- DOI: 10.3389/pore.2023.1610980
Tumor subtypes and signature model construction based on chromatin regulators for better prediction of prognosis in uveal melanoma
Abstract
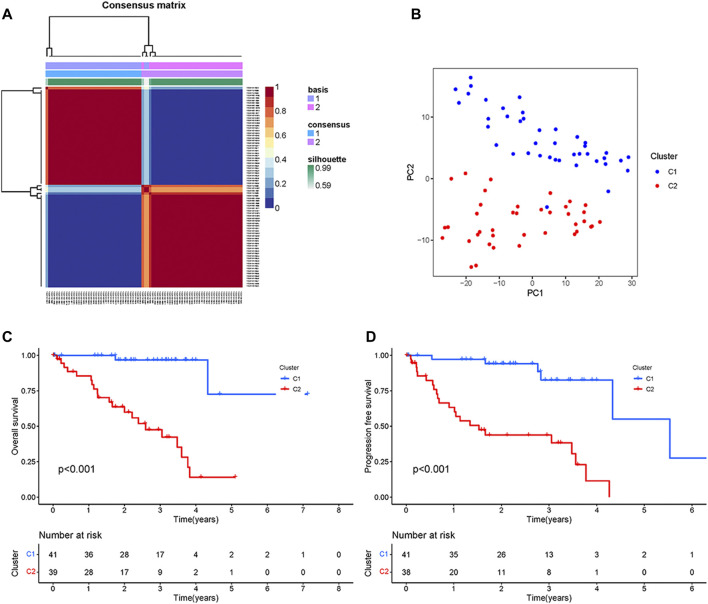
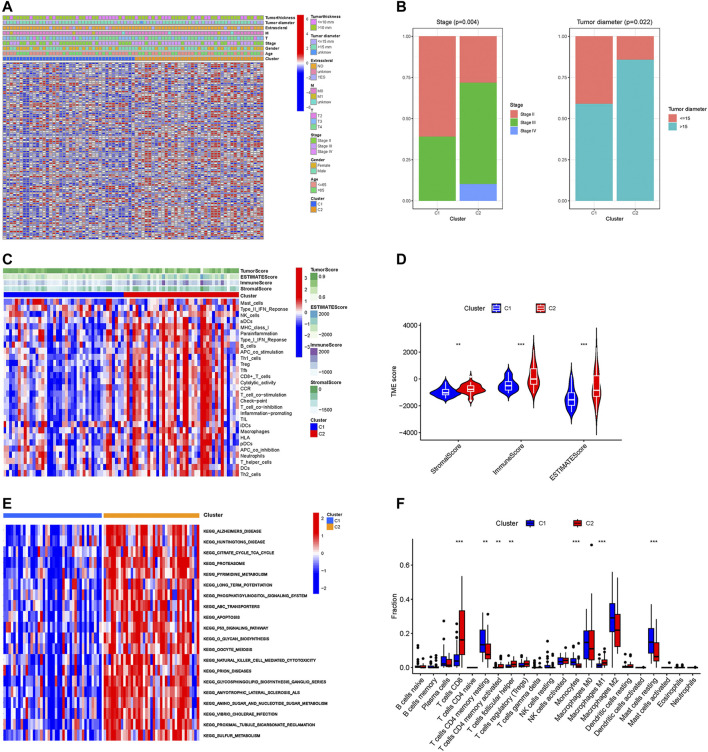
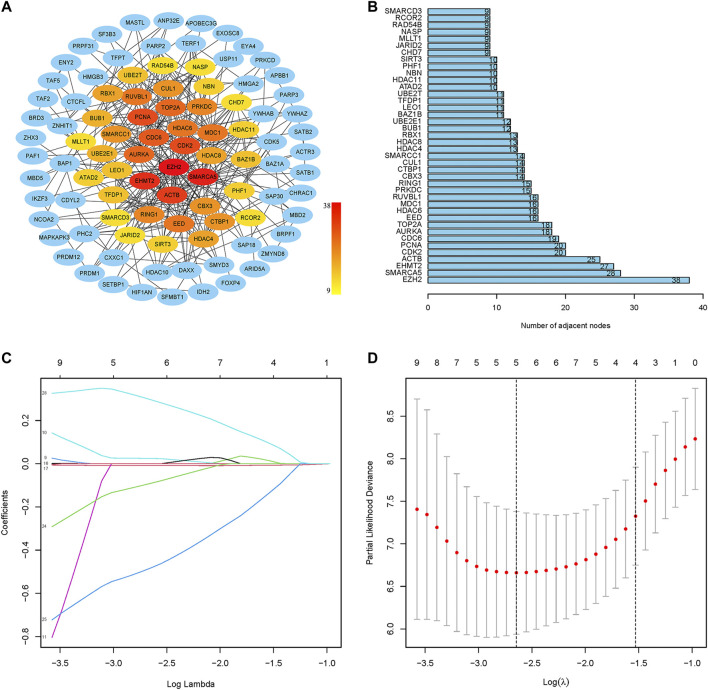
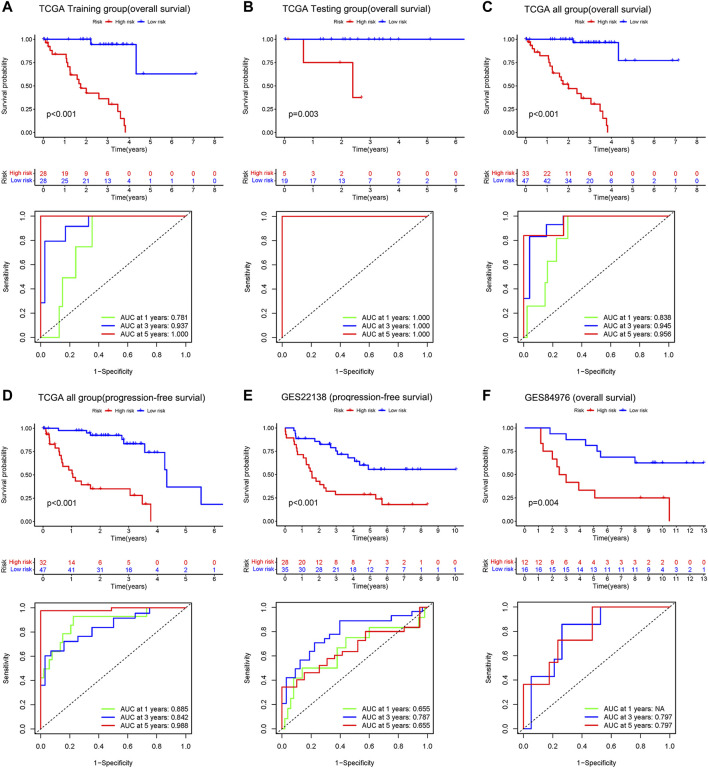
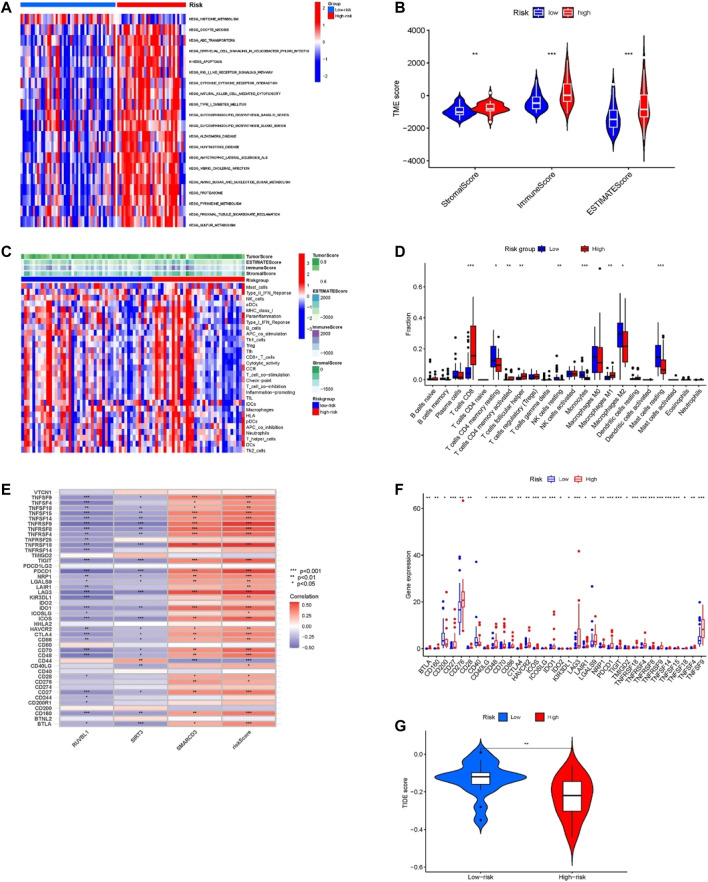
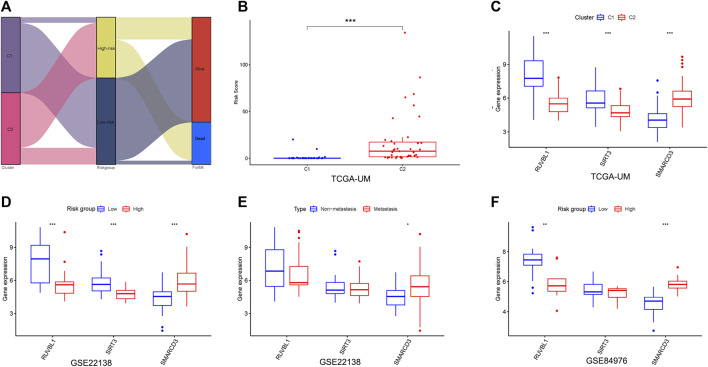
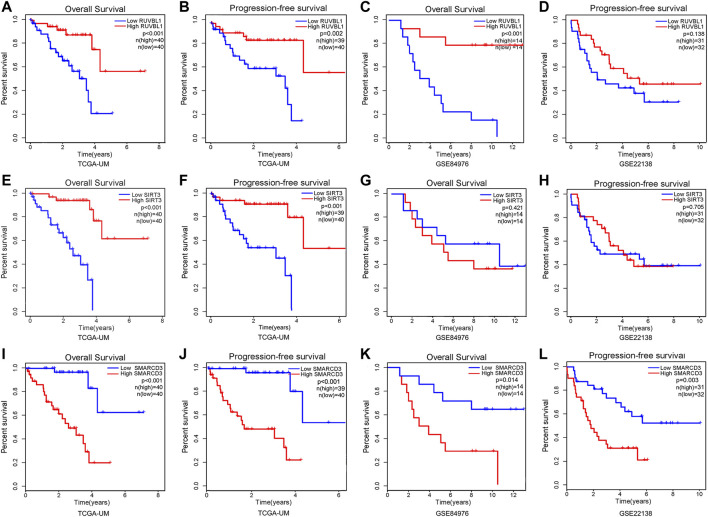
Background: Uveal Melanoma (UM) is the most prevalent primary intraocular malignancy in adults. This study assessed the importance of chromatin regulators (CRs) in UM and developed a model to predict UM prognosis. Methods: Gene expression data and clinical information for UM were obtained from public databases. Samples were typed according to the gene expression of CRs associated with UM prognosis. The prognostic key genes were further screened by the protein interaction network, and the risk model was to predict UM prognosis using the least absolute shrinkage and selection operator (LASSO) regression analysis and performed a test of the risk mode. In addition, we performed gene set variation analysis, tumor microenvironment, and tumor immune analysis between subtypes and risk groups to explore the mechanisms influencing the development of UM. Results: We constructed a signature model consisting of three CRs (RUVBL1, SIRT3, and SMARCD3), which was shown to be accurate, and valid for predicting prognostic outcomes in UM. Higher immune cell infiltration in poor prognostic subtypes and risk groups. The Tumor immune analysis and Tumor Immune Dysfunction and Exclusion (TIDE) score provided a basis for clinical immunotherapy in UM. Conclusion: The risk model has prognostic value for UM survival and provides new insights into the treatment of UM.
Keywords: TCGA; chromatin regulators; prognosis; tumor subtypes; uveal melanoma.
Copyright © 2023 Li, Xiong, Wu, Zhang, Wu, Chen, Xu and Liao.
Conflict of interest statement
The authors declare that the research was conducted in the absence of any commercial or financial relationships that could be construed as a potential conflict of interest.
Figures

Similar articles
-
A Comprehensive Prognostic and Immunological Analysis of a Six-Gene Signature Associated With Glycolysis and Immune Response in Uveal Melanoma.Front Immunol. 2021 Sep 22;12:738068. doi: 10.3389/fimmu.2021.738068. eCollection 2021. Front Immunol. 2021. PMID: 34630418 Free PMC article.
-
Immunogenic profiling of metastatic uveal melanoma discerns a potential signature related to prognosis.J Cancer Res Clin Oncol. 2024 Jan 21;150(1):23. doi: 10.1007/s00432-023-05542-z. J Cancer Res Clin Oncol. 2024. PMID: 38246894 Free PMC article.
-
Significance of Aneuploidy in Predicting Prognosis and Treatment Response of Uveal Melanoma.Curr Med Chem. 2025;32(3):579-594. doi: 10.2174/0109298673286788240123044411. Curr Med Chem. 2025. PMID: 38504568
-
Single cell RNA-sequencing in uveal melanoma: advances in heterogeneity, tumor microenvironment and immunotherapy.Front Immunol. 2024 Jun 20;15:1427348. doi: 10.3389/fimmu.2024.1427348. eCollection 2024. Front Immunol. 2024. PMID: 38966635 Free PMC article. Review.
-
An update on inflammation in uveal melanoma.Biochimie. 2023 Sep;212:114-122. doi: 10.1016/j.biochi.2023.04.013. Epub 2023 Apr 25. Biochimie. 2023. PMID: 37105300 Review.
References
MeSH terms
Substances
LinkOut - more resources
Full Text Sources
Medical
Miscellaneous