Effects of caffeoylquinic acid analogs derived from aerial parts of Artemisia iwayomogi on adipogenesis
- PMID: 37362808
- PMCID: PMC10289966
- DOI: 10.1007/s10068-023-01262-9
Effects of caffeoylquinic acid analogs derived from aerial parts of Artemisia iwayomogi on adipogenesis
Abstract
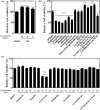
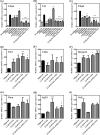
Artemisia iwayomogi (AI) is a perennial herb found in Korea. Its ground parts are dried and used in food and traditional medicine for treating hepatitis, inflammation, cholelithiasis, and jaundice. In this study, the anti-obesity effects of single compounds isolated from AI extracts on adipose tissue were investigated. Results demonstrated that caffeoylquinic acid analogs strongly inhibited adipocyte differentiation from 3T3-L1 preadipocytes and reduced neutral lipids in differentiated adipocytes. Accordingly, lipid accumulation in adipocytes decreased, and lipid droplets became granulated. Caffeoylquinic acid analogs suppressed the expression of adipocyte differentiation marker genes, namely, Cebpa, Lep, and Fabp4, but it induced the expression of Ucp1, Ppargc1a, and Fgf21, which are browning biomarkers. Therefore, caffeoylquinic acid analogs from AI inhibited preadipocyte differentiation and induced adipose tissue browning, suggesting that these compounds could be promising therapeutic agents for obesity.
Keywords: Adipogenesis; Adipose tissue; Artemisia iwayomogi; Caffeoylquinic acid; Preadipocyte.
© The Korean Society of Food Science and Technology 2023. Springer Nature or its licensor (e.g. a society or other partner) holds exclusive rights to this article under a publishing agreement with the author(s) or other rightsholder(s); author self-archiving of the accepted manuscript version of this article is solely governed by the terms of such publishing agreement and applicable law.
Conflict of interest statement
Competing interestsThe authors declare that they have no known competing financial interests or personal relationships that could have appeared to influence the work reported in this paper.
Figures


Similar articles
-
The anti-angiogenic herbal extracts Ob-X from Morus alba, Melissa officinalis, and Artemisia capillaris suppresses adipogenesis in 3T3-L1 adipocytes.Pharm Biol. 2011 Aug;49(8):775-83. doi: 10.3109/13880209.2010.547208. Epub 2011 Mar 31. Pharm Biol. 2011. PMID: 21449830
-
The role and possible mechanism of lncRNA U90926 in modulating 3T3-L1 preadipocyte differentiation.Int J Obes (Lond). 2017 Feb;41(2):299-308. doi: 10.1038/ijo.2016.189. Epub 2016 Oct 26. Int J Obes (Lond). 2017. PMID: 27780975 Free PMC article.
-
Placental extract suppresses differentiation of 3T3-L1 preadipocytes to mature adipocytes via accelerated activation of p38 MAPK during the early phase of adipogenesis.Nutr Metab (Lond). 2019 May 20;16:32. doi: 10.1186/s12986-019-0361-8. eCollection 2019. Nutr Metab (Lond). 2019. PMID: 31139234 Free PMC article.
-
Synergistic effects of Artemisia iwayomogi and Curcuma longa radix on high-fat diet-induced hyperlipidemia in a mouse model.J Ethnopharmacol. 2015 Sep 15;173:217-24. doi: 10.1016/j.jep.2015.07.021. Epub 2015 Jul 23. J Ethnopharmacol. 2015. PMID: 26212022
-
The green algal carotenoid siphonaxanthin inhibits adipogenesis in 3T3-L1 preadipocytes and the accumulation of lipids in white adipose tissue of KK-Ay mice.J Nutr. 2015 Mar;145(3):490-8. doi: 10.3945/jn.114.200931. Epub 2014 Dec 24. J Nutr. 2015. PMID: 25733464
Cited by
-
Optimizing a rapid tissue culture method for steviol glycoside production from Stevia rebaudiana to address egypt's sugar deficit.Sci Rep. 2025 Jul 15;15(1):25495. doi: 10.1038/s41598-025-10491-3. Sci Rep. 2025. PMID: 40665116 Free PMC article.
-
Discovery and Development of Caffeic Acid Analogs as Versatile Therapeutic Agents.Pharmaceuticals (Basel). 2024 Oct 20;17(10):1403. doi: 10.3390/ph17101403. Pharmaceuticals (Basel). 2024. PMID: 39459042 Free PMC article. Review.
References
LinkOut - more resources
Full Text Sources
Research Materials
Miscellaneous
