Role of the ST6GAL1 sialyltransferase in regulating ovarian cancer cell metabolism
- PMID: 37364046
- PMCID: PMC10560082
- DOI: 10.1093/glycob/cwad051
Role of the ST6GAL1 sialyltransferase in regulating ovarian cancer cell metabolism
Abstract
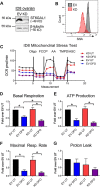
The ST6GAL1 sialyltransferase, which adds α2-6-linked sialic acids to N-glycosylated proteins, is upregulated in many malignancies including ovarian cancer. Through its activity in sialylating select surface receptors, ST6GAL1 modulates intracellular signaling to regulate tumor cell phenotype. ST6GAL1 has previously been shown to act as a survival factor that protects cancer cells from cytotoxic stressors such as hypoxia. In the present study, we investigated a role for ST6GAL1 in tumor cell metabolism. ST6GAL1 was overexpressed (OE) in OV4 ovarian cancer cells, which have low endogenous ST6GAL1, or knocked-down (KD) in ID8 ovarian cancer cells, which have high endogenous ST6GAL1. OV4 and ID8 cells with modulated ST6GAL1 expression were grown under normoxic or hypoxic conditions, and metabolism was assessed using Seahorse technology. Results showed that cells with high ST6GAL1 expression maintained a higher rate of oxidative metabolism than control cells following treatment with the hypoxia mimetic, desferrioxamine (DFO). This enrichment was not due to an increase in mitochondrial number. Glycolytic metabolism was also increased in OV4 and ID8 cells with high ST6GAL1 expression, and these cells displayed greater activity of the glycolytic enzymes, hexokinase and phosphofructokinase. Metabolism maps were generated from the combined Seahorse data, which suggested that ST6GAL1 functions to enhance the overall metabolism of tumor cells. Finally, we determined that OV4 and ID8 cells with high ST6GAL1 expression were more invasive under conditions of hypoxia. Collectively, these results highlight the importance of sialylation in regulating the metabolic phenotype of ovarian cancer cells.
Keywords: ST6GAL1; cancer stem cells; hypoxia; metabolism; sialic acid.
© The Author(s) 2023. Published by Oxford University Press. All rights reserved. For permissions, please e-mail: journals.permissions@oup.com.
Figures


Similar articles
-
Sialylation of EGFR by ST6GAL1 induces receptor activation and modulates trafficking dynamics.J Biol Chem. 2023 Oct;299(10):105217. doi: 10.1016/j.jbc.2023.105217. Epub 2023 Sep 1. J Biol Chem. 2023. PMID: 37660914 Free PMC article.
-
Sialylation of EGFR by the ST6Gal-I sialyltransferase promotes EGFR activation and resistance to gefitinib-mediated cell death.J Ovarian Res. 2018 Feb 5;11(1):12. doi: 10.1186/s13048-018-0385-0. J Ovarian Res. 2018. PMID: 29402301 Free PMC article.
-
Sox2 promotes expression of the ST6Gal-I glycosyltransferase in ovarian cancer cells.J Ovarian Res. 2019 Oct 14;12(1):93. doi: 10.1186/s13048-019-0574-5. J Ovarian Res. 2019. PMID: 31610800 Free PMC article.
-
Regulation of ST6GAL1 sialyltransferase expression in cancer cells.Glycobiology. 2021 Jun 3;31(5):530-539. doi: 10.1093/glycob/cwaa110. Glycobiology. 2021. PMID: 33320246 Free PMC article. Review.
-
ST6GAL1: A key player in cancer.Oncol Lett. 2019 Aug;18(2):983-989. doi: 10.3892/ol.2019.10458. Epub 2019 Jun 7. Oncol Lett. 2019. PMID: 31423157 Free PMC article. Review.
Cited by
-
Exploring the relationship between metabolism and immune microenvironment in osteosarcoma based on metabolic pathways.J Biomed Sci. 2024 Jan 12;31(1):4. doi: 10.1186/s12929-024-00999-7. J Biomed Sci. 2024. PMID: 38212768 Free PMC article.
-
Novel lithocholic acid-diindolylmethane hybrids as potent sialyltransferase inhibitors targeting triple-negative breast cancer: a molecular hybridization approach.RSC Med Chem. 2025 Aug 28. doi: 10.1039/d5md00390c. Online ahead of print. RSC Med Chem. 2025. PMID: 40896419 Free PMC article.
-
Spatial single-cell maps reveal ST6GAL1 promoting ovarian cancer metastasis.Glycoconj J. 2025 Feb;42(1):27-40. doi: 10.1007/s10719-025-10177-y. Epub 2025 Jan 30. Glycoconj J. 2025. PMID: 39883364
-
Sugar symphony: glycosylation in cancer metabolism and stemness.Trends Cell Biol. 2025 May;35(5):412-425. doi: 10.1016/j.tcb.2024.09.006. Epub 2024 Oct 26. Trends Cell Biol. 2025. PMID: 39462722 Review.
-
Aberrant Sialylation in Ovarian Cancer: Orchestrating Progression, Metastasis, and Therapeutic Hurdles.Curr Med Sci. 2025 Jun;45(3):395-404. doi: 10.1007/s11596-025-00041-3. Epub 2025 Apr 17. Curr Med Sci. 2025. PMID: 40244513 Review.
References
-
- Aasheim HC, Aas-Eng DA, Deggerdal A, Blomhoff HK, Funderud S, Smeland EB. Cell-specific expression of human beta-galactoside alpha 2,6-sialyltransferase transcripts differing in the 5′ untranslated region. Eur J Biochem. 1993:213(1):467–475. - PubMed
-
- Ahmed N, Escalona R, Leung D, Chan E, Kannourakis G. Tumour microenvironment and metabolic plasticity in cancer and cancer stem cells: perspectives on metabolic and immune regulatory signatures in chemoresistant ovarian cancer stem cells. Semin Cancer Biol. 2018:53:265–281. - PubMed
-
- Bellis SL, Reis CA, Varki A, Kannagi R, Stanley P. Glycosylation changes in cancer. In: Varki A, Cummings RD, Esko JD, Stanley P, Hart GW, Aebi M, Kinoshita T, Mohnen D, Packer NH, Prestegard JH, et al., editors. Essentials of glycobiology, Chapter 47. Cold Spring Harbor, NY: Cold Spring Harbor Laboratory Press; 2022. pp. 631–644
MeSH terms
Substances
Grants and funding
LinkOut - more resources
Full Text Sources
Medical

