. 2023 Sep 1;72(9):1277-1288.
doi: 10.2337/db22-0945.

Deletion of Carboxypeptidase E in β-Cells Disrupts Proinsulin Processing but Does Not Lead to Spontaneous Development of Diabetes in Mice

Affiliations

Deletion of Carboxypeptidase E in β-Cells Disrupts Proinsulin Processing but Does Not Lead to Spontaneous Development of Diabetes in Mice

Yi-Chun Chen et al. Diabetes. .

Abstract

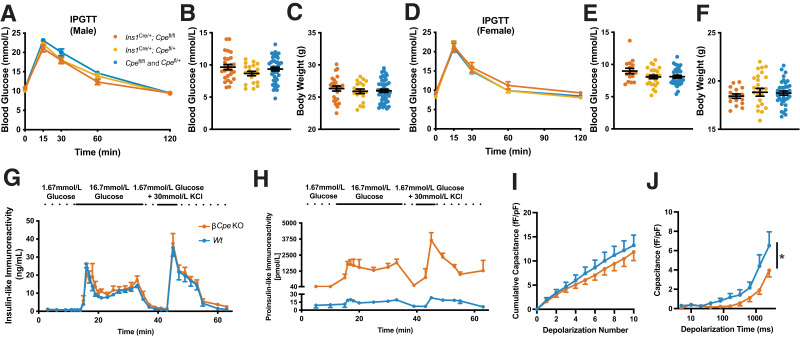
Carboxypeptidase E (CPE) facilitates the conversion of prohormones into mature hormones and is highly expressed in multiple neuroendocrine tissues. Carriers of CPE mutations have elevated plasma proinsulin and develop severe obesity and hyperglycemia. We aimed to determine whether loss of Cpe in pancreatic β-cells disrupts proinsulin processing and accelerates development of diabetes and obesity in mice. Pancreatic β-cell-specific Cpe knockout mice (βCpeKO; Cpefl/fl x Ins1Cre/+) lack mature insulin granules and have elevated proinsulin in plasma; however, glucose-and KCl-stimulated insulin secretion in βCpeKO islets remained intact. High-fat diet-fed βCpeKO mice showed weight gain and glucose tolerance comparable with those of Wt littermates. Notably, β-cell area was increased in chow-fed βCpeKO mice and β-cell replication was elevated in βCpeKO islets. Transcriptomic analysis of βCpeKO β-cells revealed elevated glycolysis and Hif1α-target gene expression. On high glucose challenge, β-cells from βCpeKO mice showed reduced mitochondrial membrane potential, increased reactive oxygen species, reduced MafA, and elevated Aldh1a3 transcript levels. Following multiple low-dose streptozotocin injections, βCpeKO mice had accelerated development of hyperglycemia with reduced β-cell insulin and Glut2 expression. These findings suggest that Cpe and proper proinsulin processing are critical in maintaining β-cell function during the development of hyperglycemia.

Article highlights: Carboxypeptidase E (Cpe) is an enzyme that removes the carboxy-terminal arginine and lysine residues from peptide precursors. Mutations in CPE lead to obesity and type 2 diabetes in humans, and whole-body Cpe knockout or mutant mice are obese and hyperglycemic and fail to convert proinsulin to insulin. We show that β-cell-specific Cpe deletion in mice (βCpeKO) does not lead to the development of obesity or hyperglycemia, even after prolonged high-fat diet treatment. However, β-cell proliferation rate and β-cell area are increased, and the development of hyperglycemia induced by multiple low-dose streptozotocin injections is accelerated in βCpeKO mice.


Conflict of interest statement

Duality of Interest. No potential conflicts of interest relevant to this article were reported.

Figures

None
Graphical abstract
Figure 1
Figure 1
Elevated proinsulin levels in βCpeKO mice. AC: Expression of CPE in human and mouse pancreatic islet cells was analyzed via immunostaining with antibodies against CPE, insulin (INS), glucagon (GCG), and somatostatin (SST). D and E: Cpe expression in βCpeKO mice was analyzed through immunoblotting (n = 3 and 3) with an antibody against Cpe. F: Representative electron micrographs of β-cells from Wt and βCpeKO mice. Scale bar = 2 μm (n = 3 and 3). G and H: 4-h fasting plasma proinsulin levels in βCpeKO and littermate male and female mice (n > 4 per genotype group per sex).
Figure 2
Figure 2
Impaired prohormone processing in βCpeKO islets. A: We analyzed islet (pro)insulin levels by nonreducing SDS-PAGE and immunoblotting using an antibody against insulin. B: Islet (pro)IAPP levels were analyzed through immunoblotting with use of antibodies against nonamidated IAPP, amidated IAPP, and IAPP. CF: Quantification of full-length proinsulin, mature insulin B-chain fragment, full-length proIAPP, and amidated mature IAPP with a top-down proteomics assay by mass spectrometry (n = 4 and 4). G: mRNA levels of Pcsk2, Iapp, Ins2, 7b2, Pcsk1n, and Pcsk1 in βCpeKO were analyzed with quantitative RT-PCR and are presented as folds over Wt (n = 6 and 6). H and I: Protein levels of proPC1/3 (87kDa), PC1/3 (66 kDa), full-length proSAAS, Cpd, and PC2 were analyzed through immunoblotting with use of antibodies against PC1/3, proSAAS, Cpd, and PC2 (n = 3 and 3). J and K: We measured islet PC1/3 and PC2 enzyme activities by cleavage of synthetic fluorogenic enzyme substrates (n = 3 and 3). L: Expression of CPD in human islets β-cells was analyzed with immunostaining with use of antibodies against Cpd and insulin. Scale bar = 25 μm. M and N: Immunofluorescence staining of proinsulin and Cpd in Wt and βCpeKO β-cells was captured by STED microscope (10 consecutive z stack images per cell were taken from mice with different genotypes, three cells were analyzed per genotype), and colocalization of proinsulin and Cpd was analyzed with the Manders method. A.U., arbitrary units.
Figure 3
Figure 3
Glucose tolerance and insulin secretion of βCpeKO mice. A: IPGTT was performed on 8-week-old chow-fed βCpeKO and littermate males (n ≥ 5 per genotype). B and C: 4-h fasting blood glucose levels and body weight of 8-week-old chow-fed βCpeKO and littermate males (n ≥ 5 per genotype). D: IPGTT was performed on 8-week-old chow-fed βCpeKO and littermate females (n ≥ 6 per genotype). E and F: 4-h fasting blood glucose and body weight of 8-week-old chow-fed βCpeKO and littermate females (n ≥ 6 per genotype). G and H: Insulin-like immunoreactivity and proinsulin-like immunoreactivity during perifusion of 1.67 mmol/L glucose, 16.7 mmol/L glucose, and 1.67 mmol/L glucose plus 30 mmol/L KCl (n = 5 and 5). I and J: Exocytosis, and exocytosis during a train of depolarization pulses with increased duration, of β-cells from islets of βCpeKO and Wt mice (>10 cells per mouse, three mice per genotype).
Figure 4
Figure 4
Comparable glucose tolerance and weight gain in HFD-fed βCpeKO and littermate mice. Body weight and 4-h fasting blood glucose were monitored every 2 weeks for 24 weeks for LFD-fed βCpeKO and their littermate male (A and B) and female (F and G) mice. IPGTT was performed after 16 weeks of LFD treatment on male (C) and female (H) mice. ITT and body mass composition analysis were performed after 20 weeks of LFD treatment on male (D and E) and female (I and J) mice (n ≥ 8 per group). Body weight and 4-h fasting blood glucose were monitored every 2 weeks for 24 weeks, on HFD-fed βCpeKO and their littermate male (K and L) and female (P and Q) mice. IPGTT was performed after 16 weeks of HFD treatment on male (M) and female (R) mice. ITT and body mass composition analysis were performed after 20 weeks of HFD treatment on male (N and O) and female (S and T) mice (n ≥ 8 per group).
Figure 5
Figure 5
βCpeKO mice have increased β-cell area and β-cell replication. AD: β-Cell area was analyzed with insulin immunostaining of pancreatic sections from male or female βCpeKO and littermate mice after 24 weeks of LFD or HFD (n ≥ 4 per group). E: We analyzed β-cell replication rate by calculating EdU+ and insulin+ cells in dispersed βCpeKO and Wt islets treated with 5 mmol/L glucose or 20 mmol/L glucose for 72 h (n ≥ 7 per group). F: Timeline of in vivo β-cell replication experiment. G and H: IPGTT was performed in inducible β-cell–specific Cpe knockout mice 5 days after last tamoxifen gavage (n ≥ 5 per group). I and J: β-Cell replication rate was analyzed by calculating EdU+ and insulin+ cells in pancreatic sections from βCpeKO and Wt male or female mice treated with 60% HFD for 48 h (n ≥ 4 per group). AUC, area under the curve; GTT, glucose tolerance test; wk, week.
Figure 6
Figure 6
Altered glycolytic transcripts and increased proinsulin biosynthesis in βCpeKO islets. A: Transcriptomic analysis of islet β-cells from 16-week-old chow-fed βCpeKO and Wt mice (n = 3 and 3). Data are presented as a volcano plot with significantly up- or downregulated genes annotated. B: Results from GSEA are presented as EnrichmentMap. Red, upregulated gene sets; blue, downregulated gene sets. C: Glucose uptake was analyzed by quantifying 2-NBDG fluorescence intensity of dispersed live islet cells from βCpeKO and Wt mice via flow cytometer (n = 6 and 6). D: Baseline-normalized oxygen consumption rate of dispersed islet cells from βCpeKO and Wt mice was analyzed (technical triplicate per sample, three samples per genotype). E: Freshly isolated islets were equilibrated in methionine-free media and pulsed with 5 mmol/L or 25 mmol/L l-azidohomoalaine (AHA)-containing media for 90 min. Islet protein pellets were click conjugated with biotin alkyne, immunoprecipitated (IP) with avidin, and analyzed with immunoblotting (IB) with use of streptavidin (Strep) and an anti-insulin antibody. F: Proinsulin oligomers were analyzed with immunoblotting with an antibody against proinsulin oligomers (monoclonal antibody CCI-17). Down, downregulated; FCCP, carbonyl cyanide 4-(trifluoromethoxy)phenylhydrazone; MFI, mean fluorescence intensity; Oligo, oligomycin; Rot/AA, rotenone and antimycin A; Up, upregulated.
Figure 7
Figure 7
Mitochondrial morphology and function were disturbed in islet cells from βCpeKO mice. A: Representative electron micrographs of mitochondria in β-cells from βCpeKO and Wt mice. B and C: Total mitochondria (Mt) area and average mitochondrial size in β-cells were quantified. Each dot represents the average of two to six images from one mouse (>400 mitochondria were analyzed per mouse) (n = 3 per genotype). D: Representative immunofluorescence staining of mitochondria with MTG in islet cells from βCpeKO and Wt mice. EH: Mitochondria numbers, area, perimeter, and branch number were quantified. Each dot represents one cell, 10–15 cells per mouse, n ≥ 3 per genotype. I: mtDNA content of islets from βCpeKO and Wt mice was analyzed with quantitative RT-PCR with ND1 (mtDNA) and 16S (nuclear DNA [nDNA]) primer probes, presented as mtDNA-to-nDNA ratio (n = 5 per genotype). JL: Mitochondrial membrane potential, mitochondrial ROS levels, and cellular ROS levels were analyzed via live cell imaging in 5 mmol/L or 25 mmol/L glucose–treated dispersed islet cells with use of TMRM, MTG, MitoSOX, and CellROX dyes. Each dot represents one cell, 10–15 cells per mouse, n ≥ 3 per genotype. M–Q: Quantitative RT-PCR analysis of Pgc1α, MafA, Aldh1a3, Pfkp, and Xbp1s in βCpeKO and Wt mouse islets treated with 5 mmol/L or 25 mmol/L glucose for 48 h (n = 6 per group). A.U., arbitrary units; MFI, mean fluorescence intensity.
Figure 8
Figure 8
βCpeKO mice have accelerated development of MLD-STZ–induced hyperglycemia. A: Timeline of MLD-STZ experiment. B: Fasting blood glucose levels of βCpeKO and littermate mice administered with a buffer (empty circle with dotted line) or MLD-STZ (filled circle with solid line). C and D: IPGTT was performed 7 days after the last STZ injection, and excursion area under the glucose tolerance test curve was analyzed (n ≥ 10 per group). E: β-Cell area of MLD-STZ–treated βCpeKO and Wt mice (n = 9 and 9). F: β-Cell death was analyzed with use of pancreatic sections of MLD-STZ–treated βCpeKO and Wt mice with TUNEL and insulin staining (n = 8 and 8). GL: Frequency and staining intensity of insulin+, Glut2+, and Aldh1a3+ cells in pancreatic sections of MLD-STZ βCpeKO and Wt mice were analyzed. (GI: Each dot represents one islet. JL: Each dot represents average fluorescent intensity of islets from one pancreatic section of one mouse; n ≥ 5 per group.) AUC, area under the curve; A.U., arbitrary units; GTT, glucose tolerance test; MFI, mean fluorescence intensity.

Similar articles

Cited by

References

    1. Zhu X, Orci L, Carroll R, Norrbom C, Ravazzola M, Steiner DF. Severe block in processing of proinsulin to insulin accompanied by elevation of des-64,65 proinsulin intermediates in islets of mice lacking prohormone convertase 1/3. Proc Natl Acad Sci U S A 2002;99:10299–10304 - PMC - PubMed
    1. Furuta M, Carroll R, Martin S, et al. . Incomplete processing of proinsulin to insulin accompanied by elevation of Des-31,32 proinsulin intermediates in islets of mice lacking active PC2. J Biol Chem 1998;273:3431–3437 - PubMed
    1. Davidson HW, Hutton JC. The insulin-secretory-granule carboxypeptidase H. Purification and demonstration of involvement in proinsulin processing. Biochem J 1987;245:575–582 - PMC - PubMed
    1. Wei FY, Suzuki T, Watanabe S, et al. . Deficit of tRNA(Lys) modification by Cdkal1 causes the development of type 2 diabetes in mice. J Clin Invest 2011;121:3598–3608 - PMC - PubMed
    1. Tran DT, Pottekat A, Mir SA, et al. . Unbiased profiling of the human proinsulin biosynthetic interaction network reveals a role for peroxiredoxin 4 in proinsulin folding. Diabetes 2020;69:1723–1734 - PMC - PubMed

Publication types