. 2023 Jun 26;14(1):3795.
doi: 10.1038/s41467-023-39011-5.

The long non-coding RNA NEAT1 is a ΔNp63 target gene modulating epidermal differentiation

Affiliations

The long non-coding RNA NEAT1 is a ΔNp63 target gene modulating epidermal differentiation

Claudia Fierro et al. Nat Commun. .

Abstract

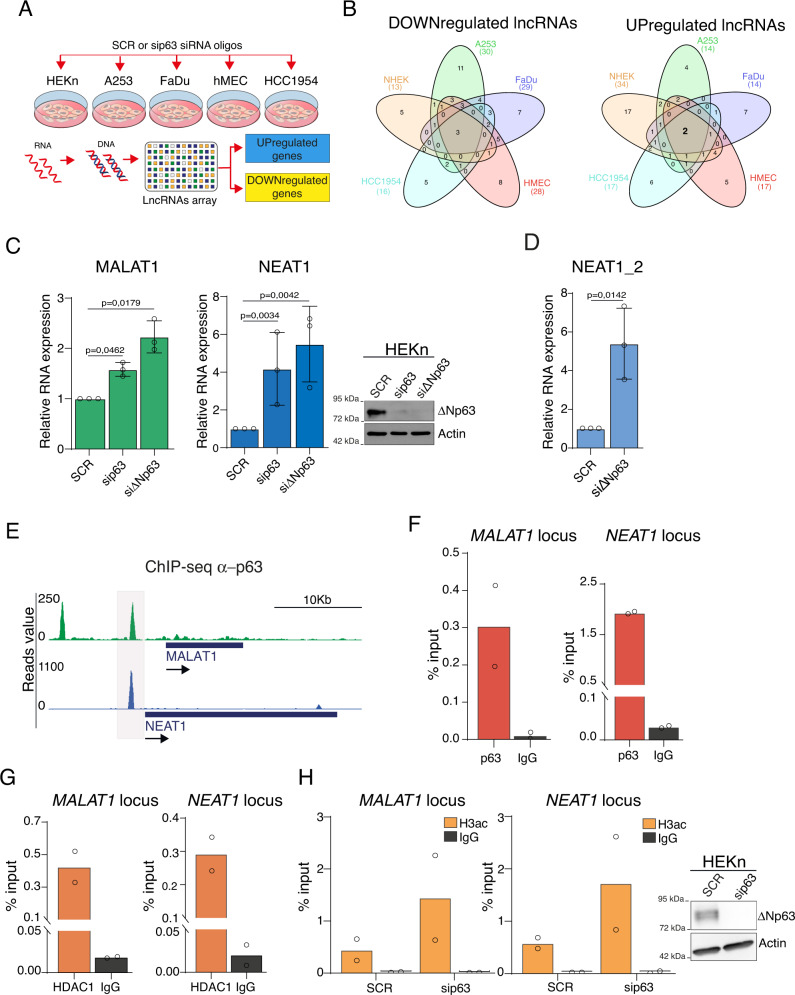
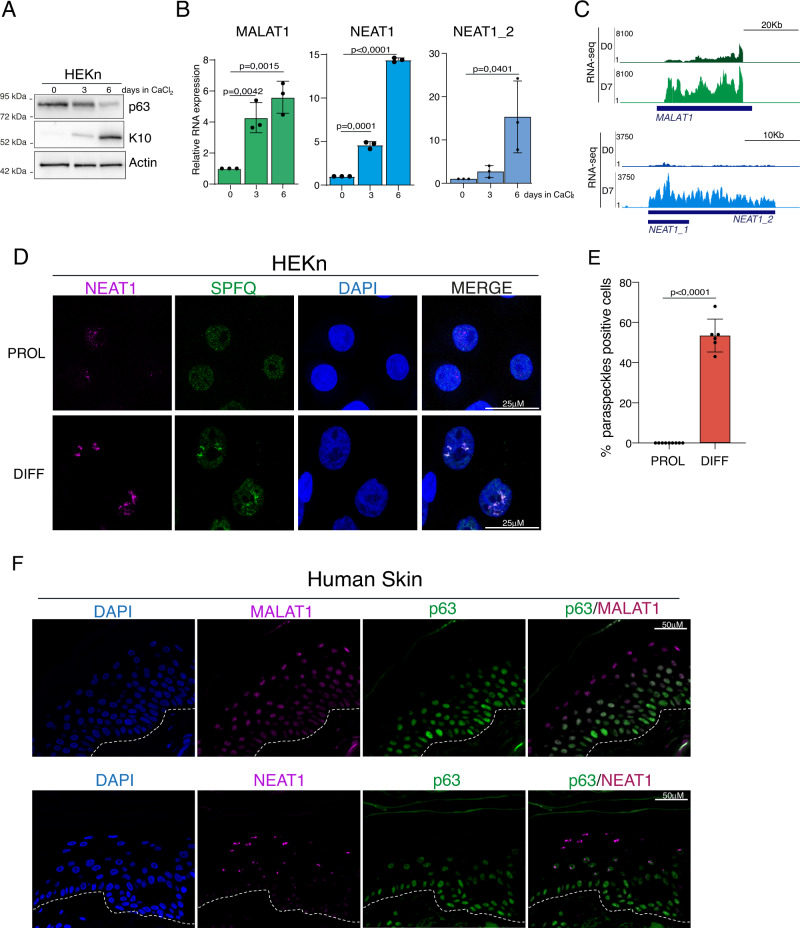
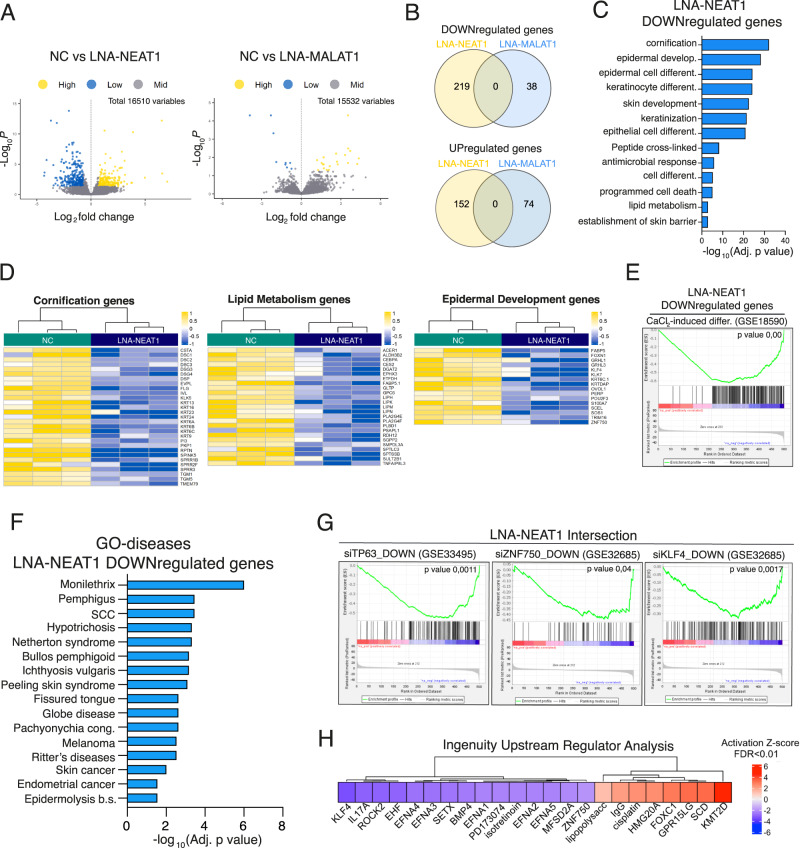
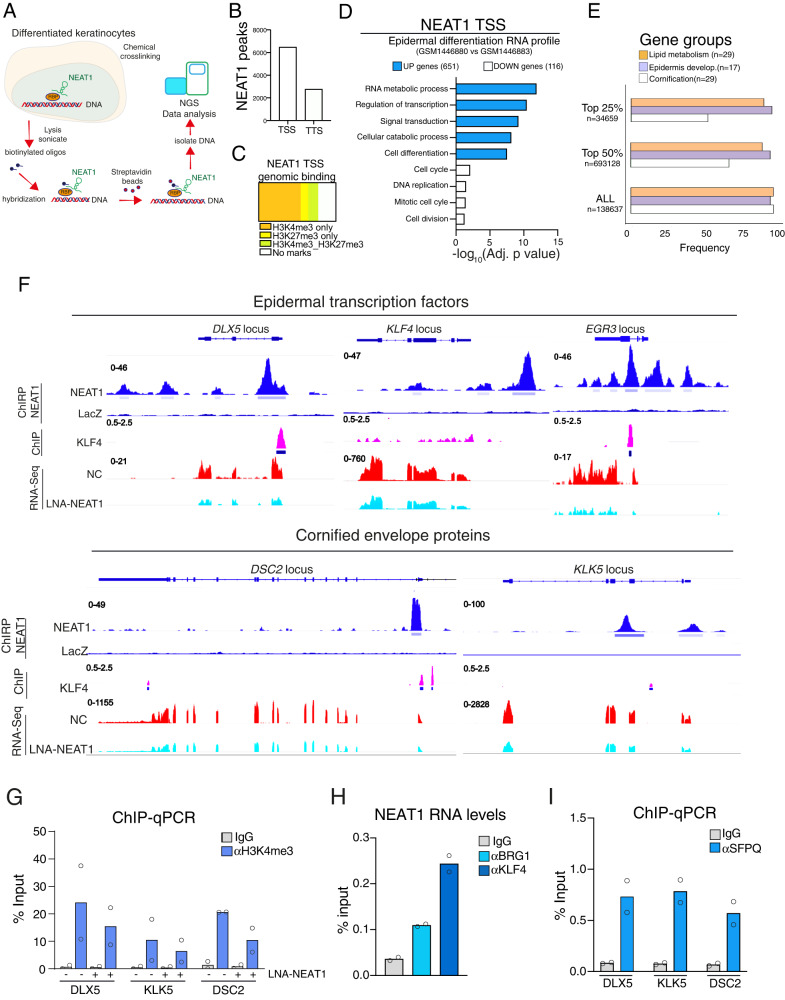
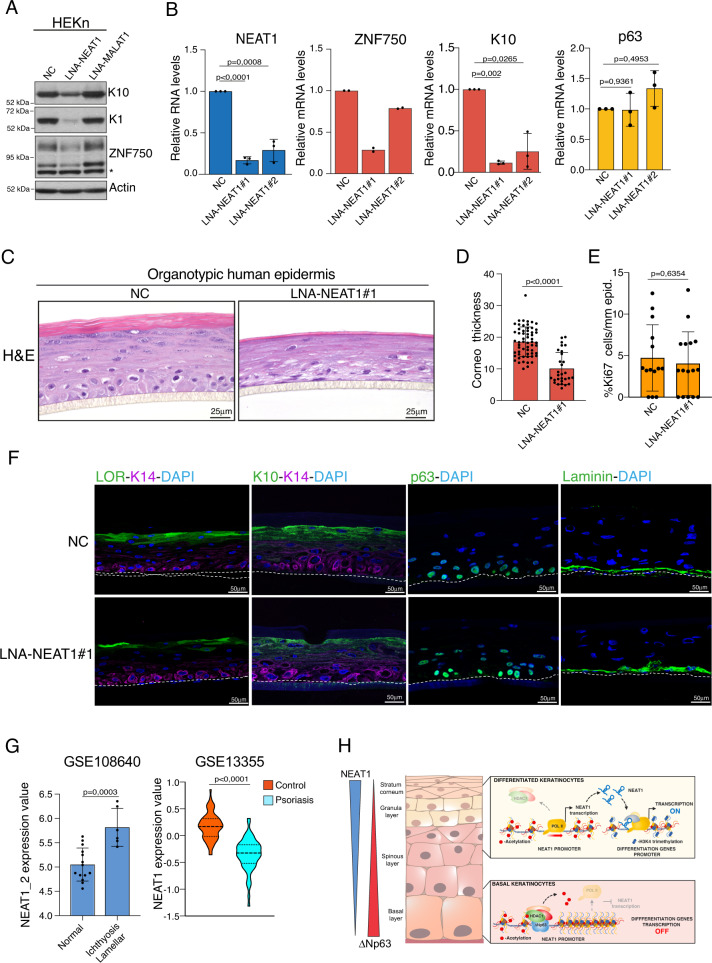
The transcription factor ΔNp63 regulates epithelial stem cell function and maintains the integrity of stratified epithelial tissues by acting as transcriptional repressor or activator towards a distinct subset of protein-coding genes and microRNAs. However, our knowledge of the functional link between ∆Np63 transcriptional activity and long non-coding RNAs (lncRNAs) expression is quite limited. Here, we show that in proliferating human keratinocytes ∆Np63 represses the expression of the lncRNA NEAT1 by recruiting the histone deacetylase HDAC1 to the proximal promoter of NEAT1 genomic locus. Upon induction of differentiation, ∆Np63 down-regulation is associated by a marked increase of NEAT1 RNA levels, resulting in an increased assembly of paraspeckles foci both in vitro and in human skin tissues. RNA-seq analysis associated with global DNA binding profile (ChIRP-seq) revealed that NEAT1 associates with the promoter of key epithelial transcription factors sustaining their expression during epidermal differentiation. These molecular events might explain the inability of NEAT1-depleted keratinocytes to undergo the proper formation of epidermal layers. Collectively, these data uncover the lncRNA NEAT1 as an additional player of the intricate network orchestrating epidermal morphogenesis.


Conflict of interest statement

The authors declare no competing interests.

Figures

Fig. 1
Fig. 1. ΔNp63 represses NEAT1 and MALAT1 lncRNAs expression by an HDAC-dependent mechanism.
A Schematic illustration of the lncRNAs array-based approach utilized to identify lncRNAs regulated by p63. Briefly, the indicated primary (HEKn and hMEC) and cancer cell types (A253, FaDu, HCC1954) were transfected with scramble (SCR) or siRNA oligos targeting p63 mRNA (sip63), and the cDNA utilized for hybridization assay of a custom-made lncRNAs array. B Venn diagrams showing shared downregulated and upregulated lncRNAs in sip63-transfected cells. C Human primary keratinocytes (HEKn) were transfected with siRNA targeting p63 (sip63), ΔNp63 isoform (siΔNp63) or non-relevant mRNA (SCR). MALAT1 and NEAT1 RNA levels were quantified by RT-qPCR (left panel). Data shown are the mean of three (n = 3) independent biological replicates ± SD. p value was calculated using two-tailed unpaired Student’s t test. In parallel, protein lysates from transfected cells were analyzed by western blotting using antibodies to the indicated proteins (right panel). D HEKn cells were transfected with siRNA targeting ΔNp63 isoform (siΔNp63) or non-relevant mRNA (SCR). NEAT1 long isoform (NEAT1_2) RNA levels were quantified by RT-qPCR. Data shown are the mean of three (n = 3) independent biological replicates ± SD. p value was calculated using two-tailed unpaired Student’s t test. E ChIP-seq enrichment of endogenous p63 at MALAT1 and NEAT1 genomic loci in HEKn cells (GSM1446927). F ChIP-qPCR showing ΔNp63 occupancy at the p63 binding site of MALAT1 and NEAT1 genomic loci. Average values from n  =  2 biological replicates measured using three technical replicates are plotted. G ChIP-qPCR showing endogenous HDAC1 occupancy at MALAT1 and NEAT1 genomic loci in HEKn cells. Average values from n  =  2 biological replicates measured using three technical replicates are plotted. H ChIP-qPCR showing Histone H3 acetylated (H3ac) occupancy at MALAT1 and NEAT1 genomic loci in HEKn cells transfected with scramble (SCR) or siRNA oligo targeting p63 (sip63) (left panels). Average values from n = 2 biological replicates measured using three technical replicates are plotted. In parallel, protein lysates from transfected cells were analyzed by western blotting using antibodies to the indicated proteins (right panel). Source data are provided as a Source Data file.
Fig. 2
Fig. 2. NEAT1 and MALAT1 expression is induced during epidermal differentiation.
Analysis of cell lysates (A) or total RNA (B) extracted from human primary keratinocytes (HEKn) at different time points (0, 3, 6 days) upon CaCl2 treatment. The protein lysates were immunoblotted for the indicated proteins. MALAT1, NEAT1 and NEAT1_2 RNA levels were quantified by RT-qPCR. Data shown are the mean of three (n = 3) independent biological replicates ± SD. p value was calculated using two-tailed unpaired Student’s t test. C MALAT1 and NEAT1 RNA-seq reads in proliferating keratinocytes (D0) or upon 7 days of CaCl2 treatment (D7) (GSM1446880, GSM1446883). D RNA FISH of endogenous NEAT1 (magenta) and immunostaining of SFPQ (green) in proliferating (PROL) or differentiated (DIFF) HEKn cells. Nuclei were visualized by DAPI (blue) counterstaining. Scale bars, 25 µm. E Quantification of paraspeckle structures. Data shown are the mean of 170 nuclei (n = 170) analysis ± SD. p value was calculated using two-tailed unpaired Student’s t test. The experiment was repeated twice with similar results (n = 2). F Representative confocal images of MALAT1 and NEAT1 localization by RNA FISH in human skin tissue. Basal cells and nuclei were revealed by p63 immunostaining and DAPI counterstaining, respectively. Dotted white line demarcates the epidermal basement membrane. Scale bars, 50 µm. The experiment was repeated twice with similar results (n = 2). Source data are provided as a Source Data file.
Fig. 3
Fig. 3. NEAT1 controls the expression of key epidermal differentiation genes.
A Volcano plots displaying gene expression Log2 fold changes and their respective statistical score (p value) of negative LNA GapmeR control (NC) vs LNA GapmeR targeting MALAT1 (LNA-MALAT1) or NEAT1 (LNA-NEAT1) transfected differentiated HEKn cells. Differential expression analysis was carried out using DESeq2 package. Volcano plot was generated with Enhanced Volcano R package and statistical analyses were carried out using R software. P = FDR (False Discovery Rate) adjusted p value. B Venn diagram showing the shared downregulated genes and upregulated genes in LNA-NEAT1 or LNA-MALAT1 transfected HEKn cells. C Barplot showing the top gene ontology (GO) terms for Biological Process of the downregulated genes upon LNA-NEAT1 transfection of differentiated HEKn cells. GO terms were ordered by FDR (False Discovery Rate) adjusted p value calculated by ShinyGO version 0.76. D Heatmap showing the unsupervised hierarchical clustering of genes associated to the top GO terms in negative control (NC, green) or LNA-NEAT1 (violet) transfected differentiated HEKn cells. Color scheme: yellow (highest) blue (lowest) VSD score. E GSEA of genes downregulated in NEAT1 depleted keratinocytes against a calcium-differentiated keratinocyte gene set (GSE18590). F Bar plot showing the top GO DISEASE terms of genes downregulated in NEAT1 depleted keratinocytes. GO terms were ordered by FDR (False Discovery Rate) adjusted p value calculated by ShinyGO version 0.76. G GSEA of LNA-NEAT1 downregulated genes set against three keratinocytes differentiation signatures resulted by p63 (GSE33495), ZNF750 (GSE32685) or KLF4 (GSE32685) depletion. H IPA Upstream regulator analysis of NEAT1 profile RNA.
Fig. 4
Fig. 4. NEAT1 binds to the promoters of key epidermal differentiation genes.
A Schematic illustration of NEAT1 ChIRP assay performed in differentiated HEKn cells (four days of CaCl2 treatment). B NEAT1 ChIRP enrichment over Transcription Starting Site (TSS) and Transcription Termination Sites (TTS) in differentiated keratinocytes. C Intersection of NEAT1 ChIRP enrichment over TSS against the indicated covalent histone modifications signatures in differentiated keratinocytes (H3K4me3, active genes, GSE98483; H3K27me3, transcriptionally silent genes, GSE175068). D Barplot showing the top gene ontology (GO) terms for Biological Process of the intersection analysis between NEAT1 binding sites over TSSs and the RNA profile of differentiated keratinocytes (GSM1446880). GO terms were ordered by FDR (False Discovery Rate) adjusted p value calculated by ShinyGO version 0.76. E Gene enrichment analysis of the indicated epidermal genes in the entire (ALL), top 50% and top 25% NEAT1 binding sites subgroups. F RNA-seq reads in control (NC) and NEAT1 depleted keratinocytes (LNA-NEAT1) together with NEAT1 ChIRP enrichment and KLF4 genomic occupancy (GSE57702) over the indicated epidermal genes in differentiated keratinocytes. G ChIP-qPCR showing the H3K4me3 epigenetic mark at the indicated epidermal genes loci in differentiated keratinocytes upon NEAT1 depletion (LNA-NEAT1). Average values from n = 2 biological replicates measured using three technical replicates are plotted. H Detection of the interactions between the SWI/SNF epigenetic factor BRG1 or the epidermal transcription factor KLF4 and NEAT1 by RIP assay. After formaldehyde cross-linking, the coimmunoprecipitated RNAs were quantified by qRT-PCR. Average values from n = 2 biological replicates measured using three technical replicates are plotted. I ChIP-qPCR showing SFPQ occupancy at the NEAT1 binding site of the indicated epidermal genes loci. Average values from n = 2 biological replicates measured using three technical replicates are plotted. Source data are provided as a Source Data file.
Fig. 5
Fig. 5. NEAT1 depletion impairs epidermal differentiation.
A Protein levels of epidermal differentiation markers, keratin 10 (K10), keratin 1 (K1) and ZNF750, were quantified by immunoblotting in differentiated keratinocytes transfected with negative LNA GapmeR control (NC), LNA GapmeR NEAT1 (LNA-NEAT1) or LNA GapmeR MALAT1 (LNA-MALAT1). B RNA levels of K10, p63 and NEAT1 were quantified by RT-qPCR in differentiated keratinocytes transfected with negative LNA GapmeR control (NC), LNA GapmeR NEAT1#1 (LNA-NEAT1#1) or LNA GapmeR NEAT1#2 (LNA-NEAT1#2). Data shown are the mean of three (n = 3) independent biological replicates ± SD. p value was calculated using two-tailed unpaired Student’s t test. For ZNF750 mRNA levels quantification, average values from n = 2 biological replicates measured using three technical replicates are plotted. C Representative image of H&E staining of NEAT1-depleted (LNA-NEAT1) organotypic human epidermis (SKIN 3D) compared to control (NC) organotypic epidermis. The experiment was repeated twice with similar results (n = 2). D Quantification of stratum corneum thickness in control (NC) and NEAT1-depleted organotypic human epidermis. Data shown are the mean of n = 59 (NC) and n = 29 (LNA-NEAT1#1) measurements ± SD. p value was calculated using two-tailed unpaired Student’s t test. E Quantification of Ki67 positive basal cells in control (NC) and NEAT1-depleted organotypic human epidermis. Data shown are the mean of n = 14 and n = 16 measurements ± SD for control and NEAT1 depleted epidermis, respectively. p value was calculated using two-tailed unpaired Student’s t test. F Representative images of the immunofluorescence analysis of control (NC) and NEAT1-depleted (LNA-NEAT1) organotypic skin cultures. Loricrin (LOR) and K10 are markers of differentiated layers, while keratin 14 (K14) and Laminin are markers of the basal layer. Immunofluorescence staining of p63 was used to confirm basal layer. DAPI (blue) was used to visualize nuclei. Dotted lines underline the keratinocyte-fibroblast border. Scale bars, 50 µm. The experiment was repeated twice with similar results (n = 2). G Analysis of NEAT1 expression in lamellar Ichthyosis (GSE108640) and psoriasis (GSE13355) datasets. In the lamellar Ichthyosis dataset, NEAT1_2 expression value (DNA probe 227062_at) is shown as the mean ± SD of 14 (n = 14, normal skin) and 6 (n = 6 lamellar Ichthyosis lesions) samples. In the psoriasis dataset, NEAT1 expression value (DNA probe 224565_at) is shown as the mean ± SD of 64 (n = 64, normal skin) and 58 (n = 58, psoriatic lesions) samples. p value was calculated using two-tailed unpaired Student’s t test. H Schematic model of ΔNp63-NEAT1 axis function during keratinocytes differentiation. Source data are provided as a Source Data file.

References

    1. Soares E, Zhou H. Master regulatory role of p63 in epidermal development and disease. Cellular Mol. Life Sci. 2018;75:1179–1190. doi: 10.1007/s00018-017-2701-z. - DOI - PMC - PubMed
    1. Candi E, et al. p63 in epithelial development. Cellular Mol. Life Sci. 2008;65:3126–3133. doi: 10.1007/s00018-008-8119-x. - DOI - PMC - PubMed
    1. Shalom-Feuerstein R, et al. DeltaNp63 is an ectodermal gatekeeper of epidermal morphogenesis. Cell Death Differentiation. 2011;18:887–896. doi: 10.1038/cdd.2010.159. - DOI - PMC - PubMed
    1. Yang A, et al. p63 is essential for regenerative proliferation in limb, craniofacial and epithelial development. Nature. 1999;398:714–718. doi: 10.1038/19539. - DOI - PubMed
    1. Gatti V, et al. DeltaNp63-Senataxin circuit controls keratinocyte differentiation by promoting the transcriptional termination of epidermal genes. Proc. Natl Acad. Sci. USA. 2022;119:e2104718119. doi: 10.1073/pnas.2104718119. - DOI - PMC - PubMed

Publication types