. 2023 Jun 26;14(1):3804.
doi: 10.1038/s41467-023-39487-1.

NOD1 mediates interleukin-18 processing in epithelial cells responding to Helicobacter pylori infection in mice

Affiliations

NOD1 mediates interleukin-18 processing in epithelial cells responding to Helicobacter pylori infection in mice

L S Tran et al. Nat Commun. .

Abstract

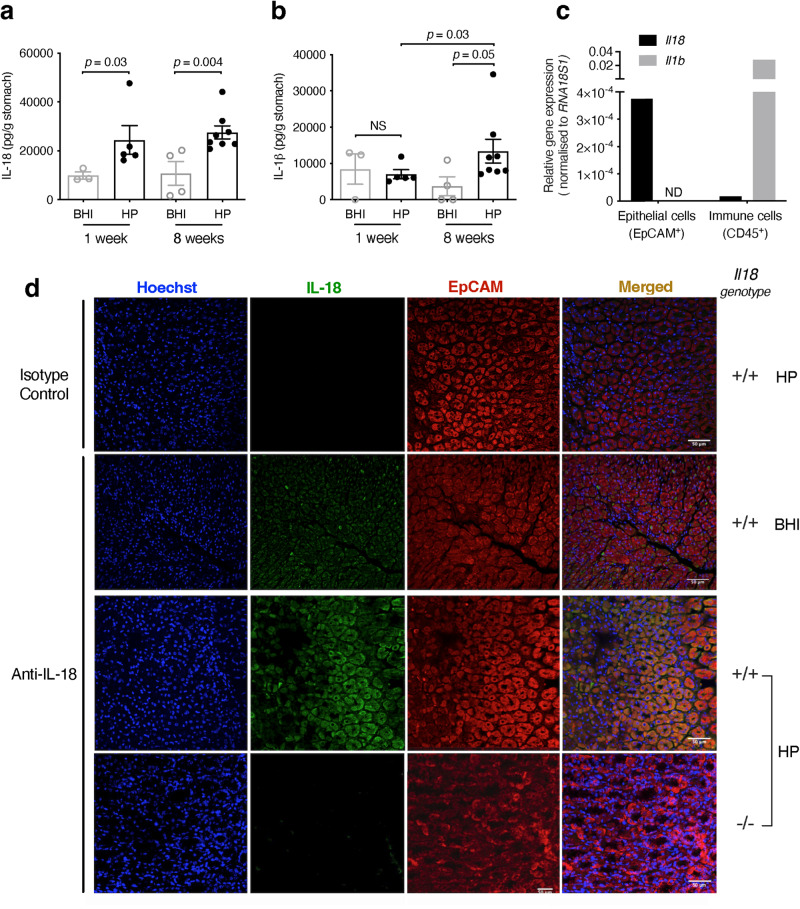
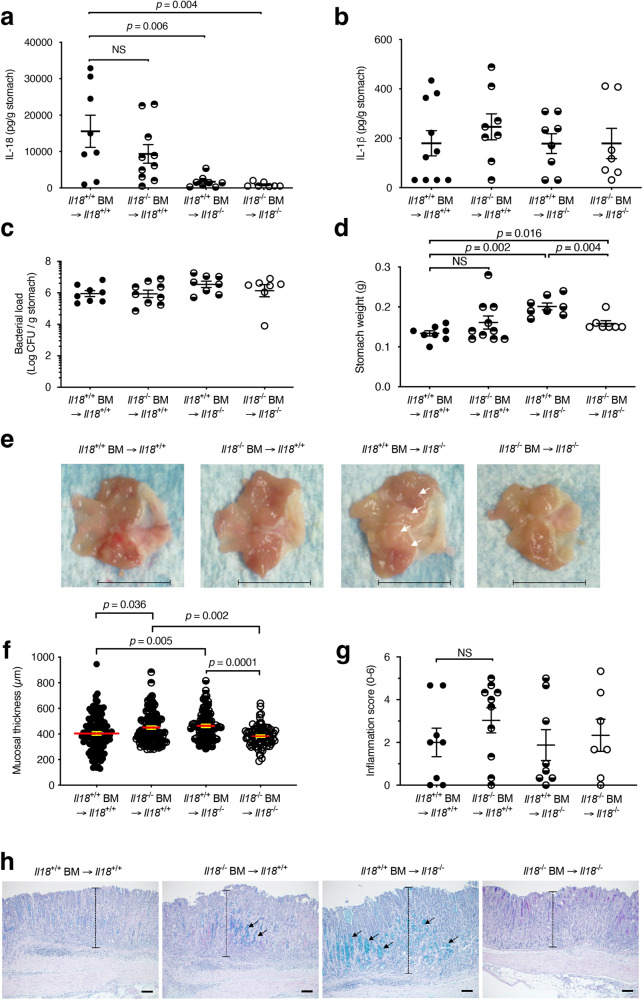
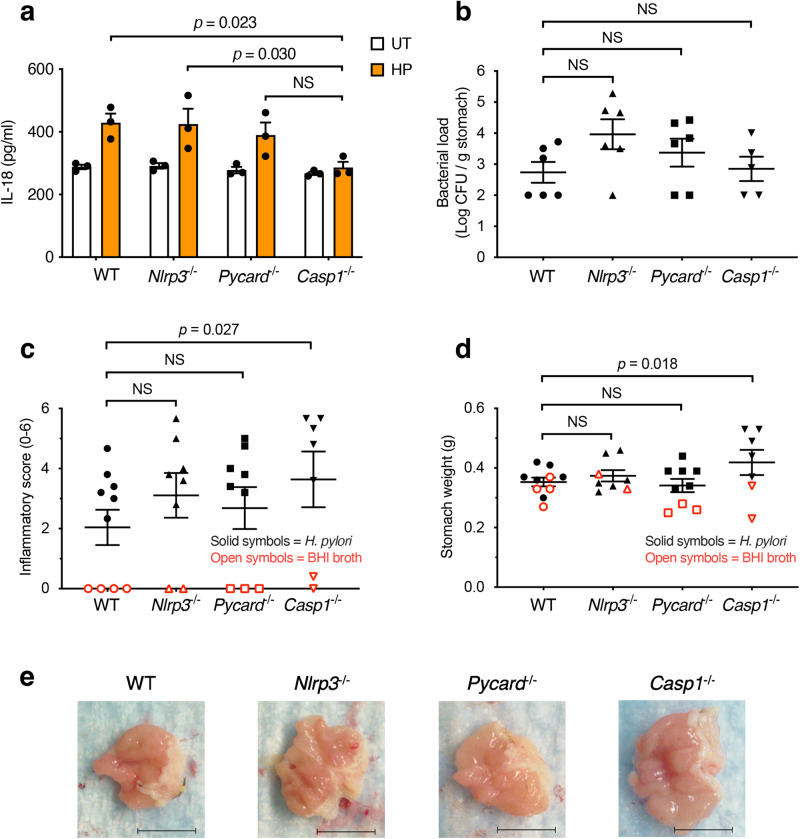
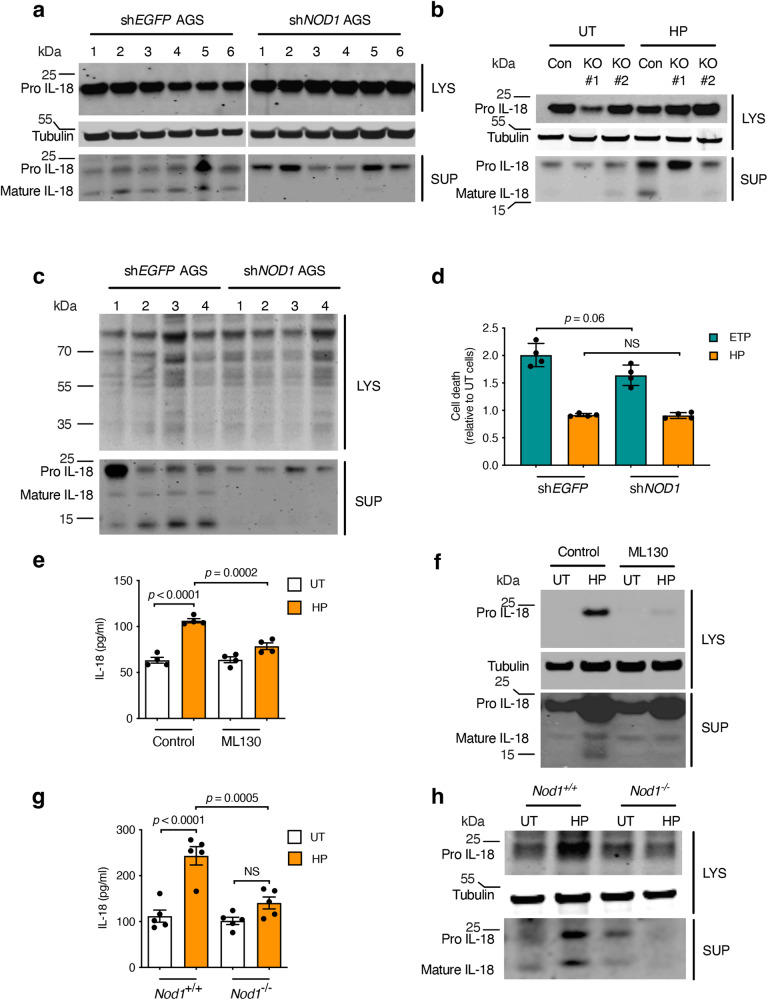
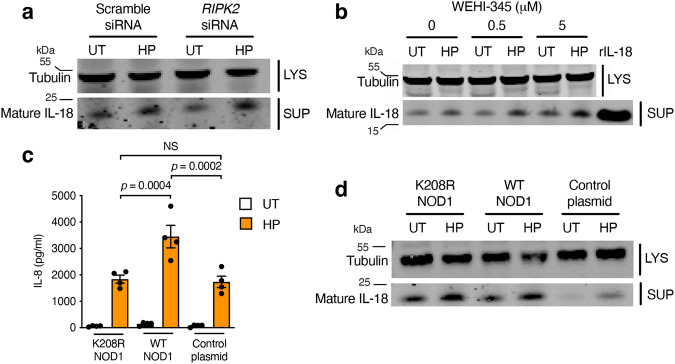
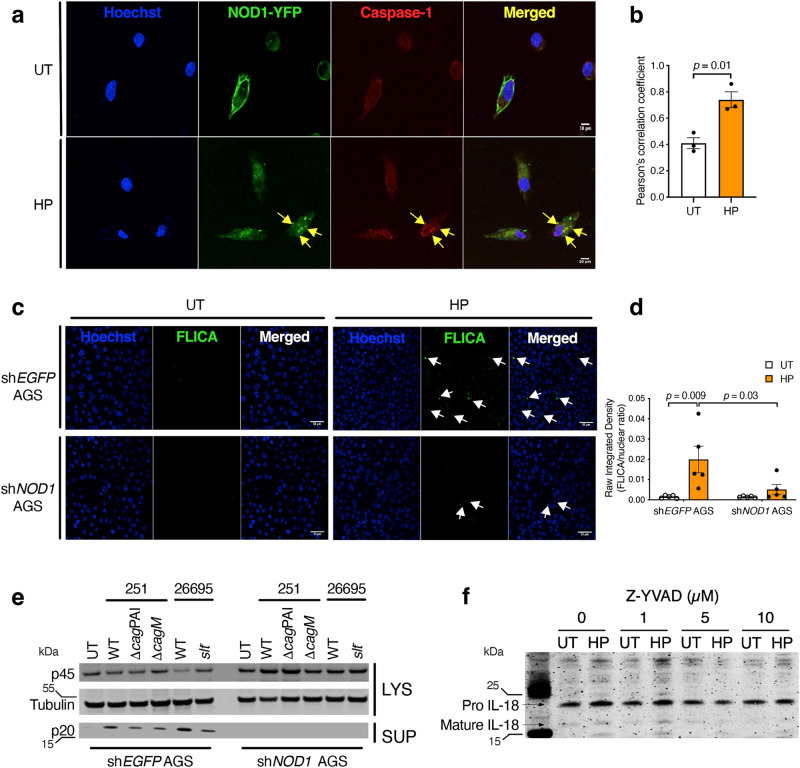
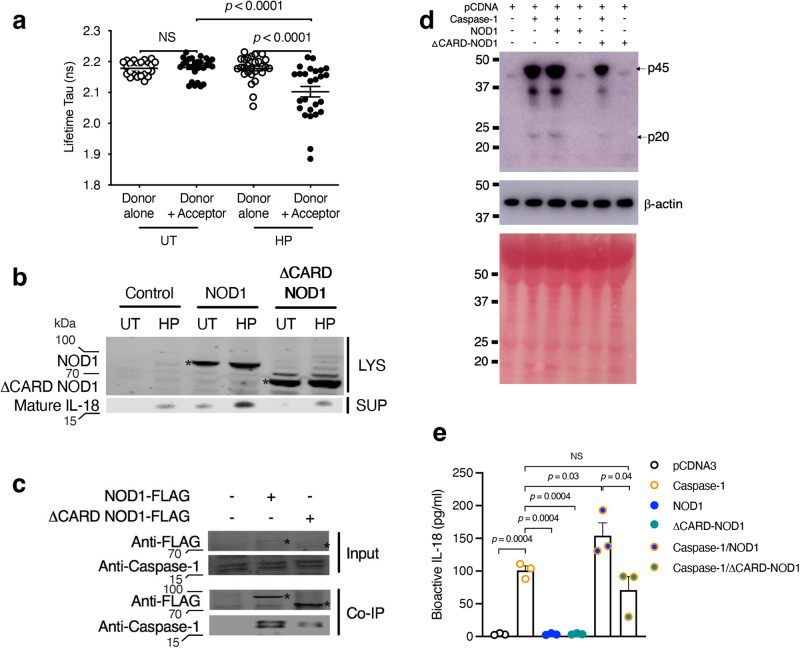
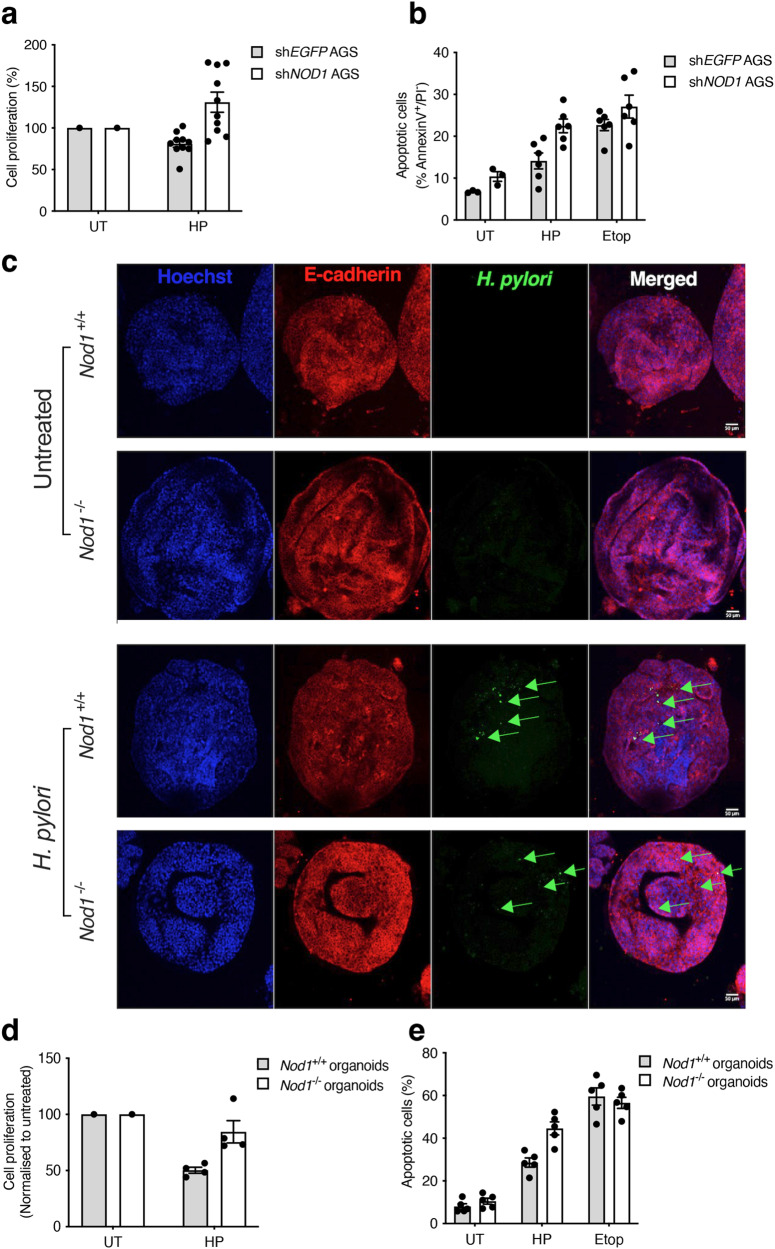
The interleukin-1 family members, IL-1β and IL-18, are processed into their biologically active forms by multi-protein complexes, known as inflammasomes. Although the inflammasome pathways that mediate IL-1β processing in myeloid cells have been defined, those involved in IL-18 processing, particularly in non-myeloid cells, are still not well understood. Here we report that the host defence molecule NOD1 regulates IL-18 processing in mouse epithelial cells in response to the mucosal pathogen, Helicobacter pylori. Specifically, NOD1 in epithelial cells mediates IL-18 processing and maturation via interactions with caspase-1, instead of the canonical inflammasome pathway involving RIPK2, NF-κB, NLRP3 and ASC. NOD1 activation and IL-18 then help maintain epithelial homoeostasis to mediate protection against pre-neoplastic changes induced by gastric H. pylori infection in vivo. Our findings thus demonstrate a function for NOD1 in epithelial cell production of bioactive IL-18 and protection against H. pylori-induced pathology.


Conflict of interest statement

The authors declare no competing interests.

Figures

Fig. 1
Fig. 1. Epithelial cells are a major source of gastric IL-18 in response to H. pylori infection.
a IL-18 and b IL-1β levels in stomach homogenates from mice administered either BHI broth (BHI) or H. pylori SS1 (HP) at 1 and 8 weeks p.i. (n = 8 and 12 male mice, respectively) c Epithelial (EpCAM+ CD45) and immune (CD45.2+ EpCAM) cells were isolated by FACS from the gastric tissues of H. pylori-infected mice and tested for Il18 and Il1b expression by qPCR. d Gastric tissue sections from H. pylori-infected Il18+/+ and Il18−/− mice were reacted with rat anti-mouse IL-18 and rabbit anti-EpCAM antibodies, followed by anti-rat Alexa Fluor® 488- and anti-rabbit Alexa Fluor® 594 conjugated secondary antibodies. Mouse IgG was used as an isotype control for IL-18 staining. Cell nuclei were stained with Hoechst 33342 and the sections analysed by confocal microscopy. Representative images from two independent experiments. Scale bar = 50 µm. a, b Data combined from two independent experiments. Each data point represents an individual mouse. Data correspond to the mean ± SEM. Significance was determined by a two-sided Student’s t-test. ND not detected.
Fig. 2
Fig. 2. Non-haematopoietic cells produce IL-18, which protects against pre-neoplastic lesions in H. pylori infection.
BM reconstitution experiments were performed by transferring BM from either Il18+/+ or Il18−/− donor mice to γ-irradiated Il18+/+ or Il18−/− recipient mice (n  = 33; 21 males, 12 females). Mice were then challenged with H. pylori SS1 and culled at 5 weeks p.i. a IL-18 and b IL-β levels in stomach homogenates. c H. pylori bacterial loads. d Stomach weights, e gross pathology (arrows showing increased mucosal thickness), f corpus mucosal thickness and g inflammation scores. h PAS-AB-stained sections of gastric tissues from BM-reconstituted mice, with arrows indicating acid mucins (in blue). Representative images from two independent experiments. Scale bars, 1 cm (e), 50 µm (h). a–d, fg Each data point represents either an individual mouse (a–d, g) or cumulative scores from 2 to 4 sections per stomach section of an individual mouse (f) and was combined from two independent experiments. Data correspond to the mean ± SEM. Significance was determined by one-way ANOVA. NS not significant (p > 0.05).
Fig. 3
Fig. 3. H. pylori induces IL-18 production independently of the canonical inflammasome.
a IL-18 production was assessed in primary gastric epithelial cells that had been isolated from WT, Nlrp3/, Pycard/ and Casp1/ mice and stimulated with H. pylori (HP) SS1 bacteria or left untreated (UT). IL-18 levels were determined after 24 h incubation. b–d WT and KO mouse strains were infected with H. pylori (solid symbols), euthanised at 24 weeks p.i. and then their stomachs were analysed for bacterial loads (b), inflammatory scores (c), weights (d) and gross pathology (e). Open symbols in panels c and d correspond to control mice administered BHI broth alone. Mouse numbers and sexes were as follows: WT (4 males, 6 females), Nlrp3/ (8 males), Pycard/ (3 males, 6 females) and Casp1/ (5 males, 2 females). Scale bar, 1 cm (e). Data correspond to the mean ± SEM, with each data point representing a biological replicate (a) or individual mouse (b–d). Significance was determined by one- or two-way ANOVA (b–d and a, respectively). NS not significant (p > 0.05).
Fig. 4
Fig. 4. NOD1 is required for H. pylori-induced IL-18 processing in epithelial cells.
a–c Pro- and mature IL-18 production in human AGS gastric epithelial cells. a AGS cells stably expressing shRNA to either EGFP (shEGFP) or NOD1 (shNOD1) were left untreated (1), or stimulated with H. pylori 251WT (2), ΔcagPAI (3) and cagM (4) mutants, as well as WT 10700 (5) or SS1 (6) bacteria. b AGS NOD1 CRISPR/Cas9 KO (two clones) or Cas9 control (CON) cells were stimulated with H. pylori 251 (HP) or left untreated (UT). c shEGFP or shNOD1 AGS cells were left untreated (1), or stimulated with BHIB medium (2), H. pylori 10700 (3), or SS1 (4) MVs (50 µg protein). Tubulin (a, b) or total protein (c) were used as loading controls. d Cell death was assessed in shEGFP or shNOD1 AGS cells, treated with H. pylori 251 (HP) or etoposide (ETP), and assessed relative to that in the respective untreated cells. e Mouse GSM06 gastric epithelial cells that had been pre-treated with NOD1 inhibitor (ML130; 5 µM) or vehicle (control) were stimulated with H. pylori (HP) SS1 or left untreated (UT). IL-18 levels were measured in culture supernatants. f Pro-IL-18 and mature IL-18 were detected in cell lysates (LYS) and supernatants (SUP), respectively. g, h Primary gastric epithelial cells from Nod1+/+ and Nod1−/− mice were stimulated with H. pylori 251 (HP) or left untreated (UT), then analysed for IL-18 production (g), pro-IL-18 and mature IL-18 (h). IL-18 processing, production and cell death were determined after overnight incubation. In all experiments, H. pylori bacteria were added to cells (MOI = 10:1) for 1 h, washed off, and the cells re-incubated for 23 h. Representative images for three independent experiments (a–c, f, h). Mean ± SEM for four (d, e) or two (g) independent experiments. Data in (g) are pooled from five primary cell preparations per genotype. Significance was determined by two-way ANOVA (d, e, g). For IL-18 production: in H. pylori-stimulated vs. UT control cells (p < 0.0001) and H. pylori-stimulated cells pre-treated or not with ML130 (p < 0.0002; e); and H. pylori-stimulated vs. UT Nod1+/+ cells (p < 0.0001) and H. pylori-stimulated Nod1+/+ vs Nod1−/− cells (p < 0.0005; g). NS not significant (p > 0.05).
Fig. 5
Fig. 5. The NOD1 adaptor protein RIPK2 is dispensable for NOD1-dependent IL-18 processing in epithelial cells.
a Human AGS gastric epithelial cells were either pre-treated with scramble or RIPK2 siRNA and then stimulated with H. pylori (HP) 251 or left untreated (UT). IL-18 processing was assessed in culture supernatants (SUP). LYS = cell lysates. b AGS cells were pre-treated with varying concentrations of the RIPK2 inhibitor WEHI-345 and then stimulated or not with H. pylori. c, d shNOD1 AGS cells were transfected with either a mutant form of NOD1 (K208R NOD1), WT NOD1 or the vector (control plasmid). IL-8 production (c) and IL-18 processing (d) were assessed in culture supernatants after 24 h incubation. Representative images for three independent experiments (a, b, d). Mean ± SEM for four independent experiments (c). Significance was determined by one-way ANOVA. NS not significant (p > 0.05).
Fig. 6
Fig. 6. NOD1 activates caspase-1 to promote IL-18 processing in epithelial cells.
a Human AGS gastric epithelial cells stably expressing shRNA to NOD1 (shNOD1) were transfected with YFP-labelled NOD1, stimulated with H. pylori (HP) 251 or left untreated (UT), then incubated with an anti-caspase-1 antibody. In response to H. pylori stimulation, NOD1 and caspase-1 molecules can be observed co-localising (arrows). Cell nuclei were stained with Hoechst 33342, the images merged and the sections were analysed by confocal microscopy. Scale = 10 µm. b Co-localisation of NOD1-YFP and caspase-1 was quantified and analysed using Pearson’s correlation coefficient. c AGS cells stably expressing shRNA to either EGFP (shEGFP) or NOD1 (shNOD1) were stimulated with H. pylori or left untreated and then incubated with FLICA, a fluorescently labelled caspase inhibitor that binds irreversibly to caspase-1. Increased levels of fluorescence can be seen in the shEGFP cells responding to H. pylori stimulation (arrows). Cell nuclei were stained with Hoechst 33342 and the images merged. Scale bar = 50 µm. d FLICA fluorescence is expressed as the raw integrated density values, determined as a ratio of the total numbers of cell nuclei, using Fiji software. e shEGFP and shNOD1 AGS cells were left untreated (UT), or stimulated with the indicated H. pylori WT and mutant strains (ΔcagPAI, cagM, slt). Pro- (p45) and mature (p20) forms of caspase-1 were detected by Western blotting of cell lysates (LYS) and supernatants (SUP). f AGS cells were pre-treated with varying concentrations (0–10 µM) of the caspase-1 inhibitor Z-YVAD, then left untreated (UT) or stimulated with H. pylori (HP). IL-18 processing was determined by Western blotting. All assays were performed after 24 h incubation. Two independent experiments. Representative images (a, c, e, f). Mean ± SEM for 3 (b) or 5 (d) fields analysed. Significance was determined by a two-tailed unpaired T-test (b) or two-way ANOVA (d).
Fig. 7
Fig. 7. NOD1 interacts with caspase-1 to promote bioactive IL-18 production.
a Human AGS gastric epithelial cells stably expressing shRNA to NOD1 (shNOD1) were transfected with NOD1-mOrange plasmid (Donor alone) or both NOD1-mOrange and caspase-1-GFP (Donor + Acceptor). Cells were then stimulated with H. pylori (HP) 251 or left untreated (UT) and NOD1-caspase-1 interactions determined by the FLIM-FRET technique. A decrease in the lifetime of the donor fluorochrome, indicative of quenching of the donor by the acceptor, indicates close proximity (<10 nm) between NOD1 and caspase-1 proteins. b–e NOD1 KO AGS cells, generated by CRISPR/Cas9 gene editing, were transfected with either full-length NOD1 (NOD1), CARD-deficient NOD1 (ΔCARD-NOD1), or caspase-1, then stimulated with H. pylori or left untreated. As a negative control, cells were transfected with pCDNA3 (d). b NOD1 and mature IL-18 were detected in cell lysate (LYS) or supernatant (SUP) samples of the transfected cells. c Lysates of transfected cells (input) were probed with antibodies to detect either FLAG-tagged proteins or endogenous caspase-1, then subjected to immunoprecipitation using an anti-FLAG antibody. The immunoprecipitated proteins were probed with anti-FLAG or anti-caspase-1 antibodies (Co-IP). d, e Transfected cells were analysed for caspase-1 processing (d) and secreted (bioactive) IL-18 production (e). d Pro (p45) and mature (p20) forms of caspase-1 were detected by Western blotting. Protein loadings were confirmed by β-actin detection and Ponceau S staining. e Levels of bioactive IL-18 production were determined using transfected cell supernatants analysed in an IL-18 reporter cell line. All assays were performed after 24 h incubation. Ten random fields of view were recorded per treatment with a minimum of five cells per field analysed (a). Representative data for two independent experiments (b–d). Mean ± SEM of duplicate values for three independent experiments (e). Significance was determined by one-way ANOVA (a) or two-sided Student’s t-test (e). UT vs. H. pylori-simulated cells with donor and acceptor (p < 0.0001); H. pylori-simulated cells with donor alone vs. donor and acceptor (p < 0.0001) (a). NS = not significant. Cells transfected with: caspase-1 vs. pCDNA3, NOD1 or ΔCARD-NOD1 (all p = 0.0004); caspase-1 vs. caspase-1/NOD1 (p = 0.03), caspase-1/ΔCARD-NOD1 (NS); and caspase-1/NOD1 vs. caspase-1/ΔCARD-NOD1 (p = 0.04) (e).
Fig. 8
Fig. 8. NOD1 maintains epithelial homoeostasis in response to H. pylori infection.
a, b Human AGS gastric epithelial cells stably expressing shRNA to either EGFP (shEGFP) or NOD1 (shNOD1) were stimulated with H. pylori (HP) 251 or left untreated (UT). Cell proliferation (a) and apoptosis (b) were determined using the MTT assay and Annexin V/PI staining, respectively. As a control, cells were treated with the apoptotic-inducing agent, etoposide (Etop; 5 μM). c–e Gastric organoids were isolated from Nod1+/+ and Nod1/ mice, then either left untreated (UT) or treated with H. pylori (HP) or etoposide (Etop). H. pylori bacteria (green) were microinjected into the lumen of organoids. c Confocal microscopy images of Nod1+/+ and Nod1/ organoids showing E-cadherin+ epithelial cells (red) with nuclei (blue) stained by Hoechst 33342. Merged images show H. pylori bacteria (green; arrows) within the lumen of organoids. d, e Gastric organoid cultures from Nod1+/+ and Nod1/ mice were assessed for changes in cell proliferation (d) and apoptosis (e) in response to H. pylori or etoposide treatment, using Presto Blue assay and Annexin V/propidium iodide staining, respectively. All assays were performed after 24 h incubation. Data correspond to the mean ± SEM. Two independent experiments. Representative images (c) and mean ± SEM for combined data in which each point corresponds to a replicate (a, b, d, e).

References

    1. Lopetuso LR, Chowdhry S, Pizarro TT. Opposing functions of classic and novel IL-1 family members in gut health and disease. Front. Immunol. 2013;4:181. doi: 10.3389/fimmu.2013.00181. - DOI - PMC - PubMed
    1. Broz P, Dixit VM. Inflammasomes: mechanism of assembly, regulation and signalling. Nat. Rev. Immunol. 2016;16:407–420. doi: 10.1038/nri.2016.58. - DOI - PubMed
    1. Sellin ME, Maslowski KM, Maloy KJ, Hardt WD. Inflammasomes of the intestinal epithelium. Trends Immunol. 2015;36:442–450. doi: 10.1016/j.it.2015.06.002. - DOI - PubMed
    1. Sakai K, et al. Levels of interleukin-18 are markedly increased in Helicobacter pylori-infected gastric mucosa among patients with specific IL18 genotypes. J. Infect. Dis. 2008;197:1752–1761. doi: 10.1086/588196. - DOI - PMC - PubMed
    1. Tomita T, et al. Expression of Interleukin-18, a Th1 cytokine, in human gastric mucosa is increased in Helicobacter pylori infection. J. Infect. Dis. 2001;183:620–627. doi: 10.1086/318541. - DOI - PubMed

Publication types

MeSH terms