. 2023 Jun 26;14(1):3754.
doi: 10.1038/s41467-023-39060-w.

Border-associated macrophages mediate the neuroinflammatory response in an alpha-synuclein model of Parkinson disease

Affiliations

Border-associated macrophages mediate the neuroinflammatory response in an alpha-synuclein model of Parkinson disease

A M Schonhoff et al. Nat Commun. .

Abstract

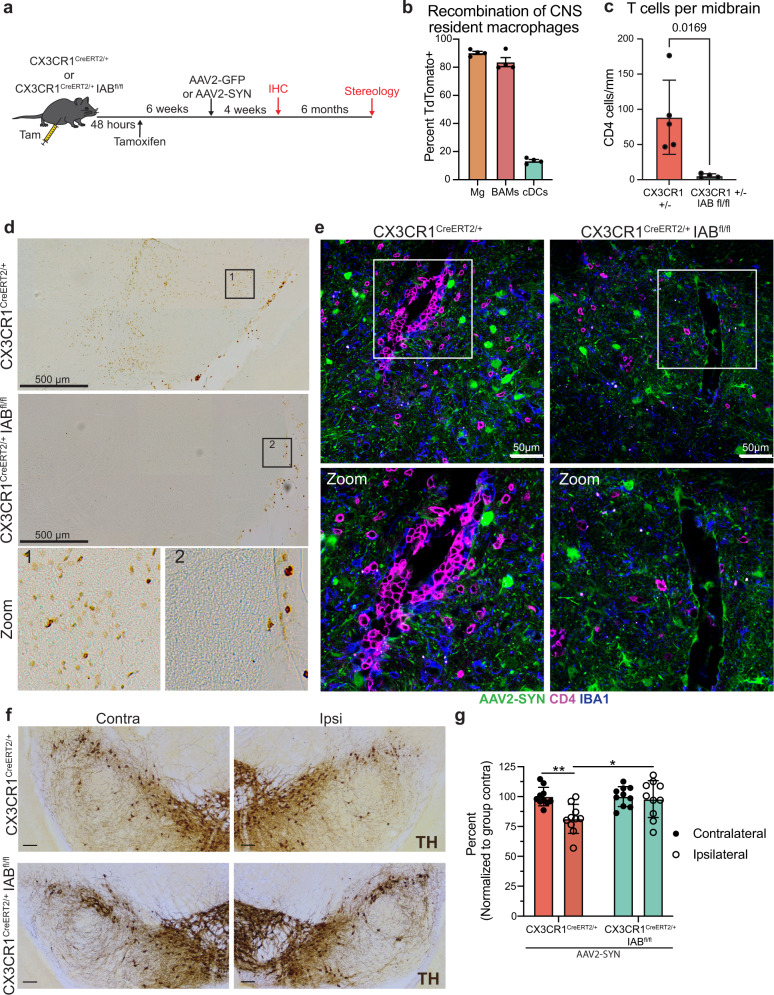
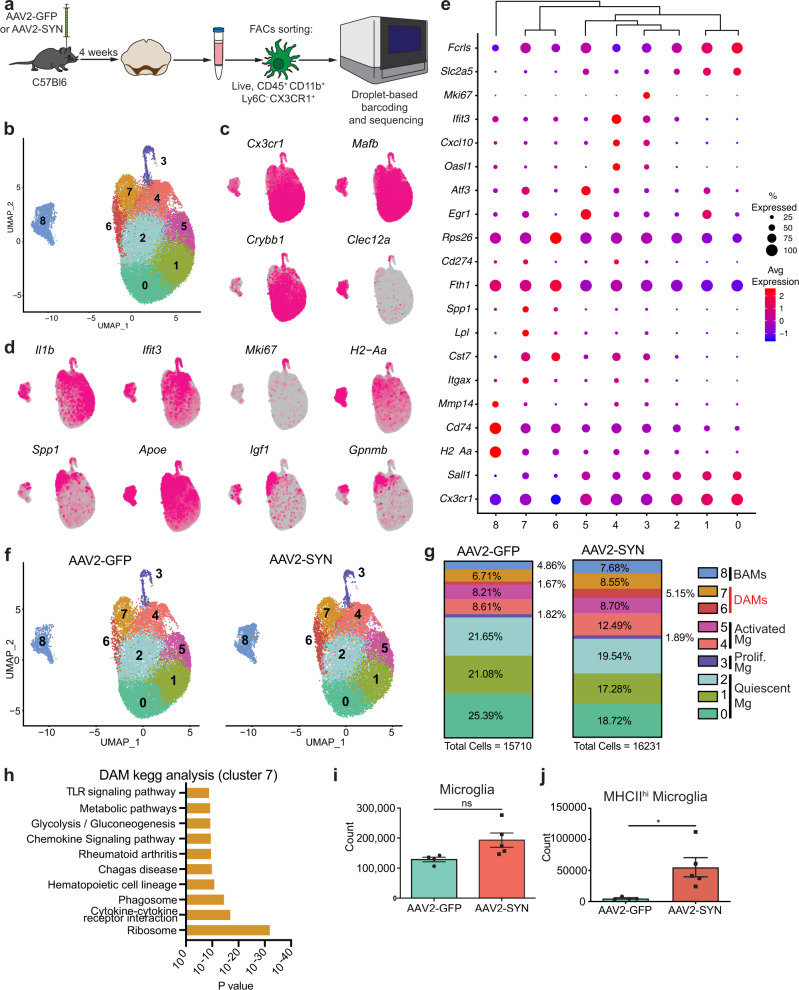
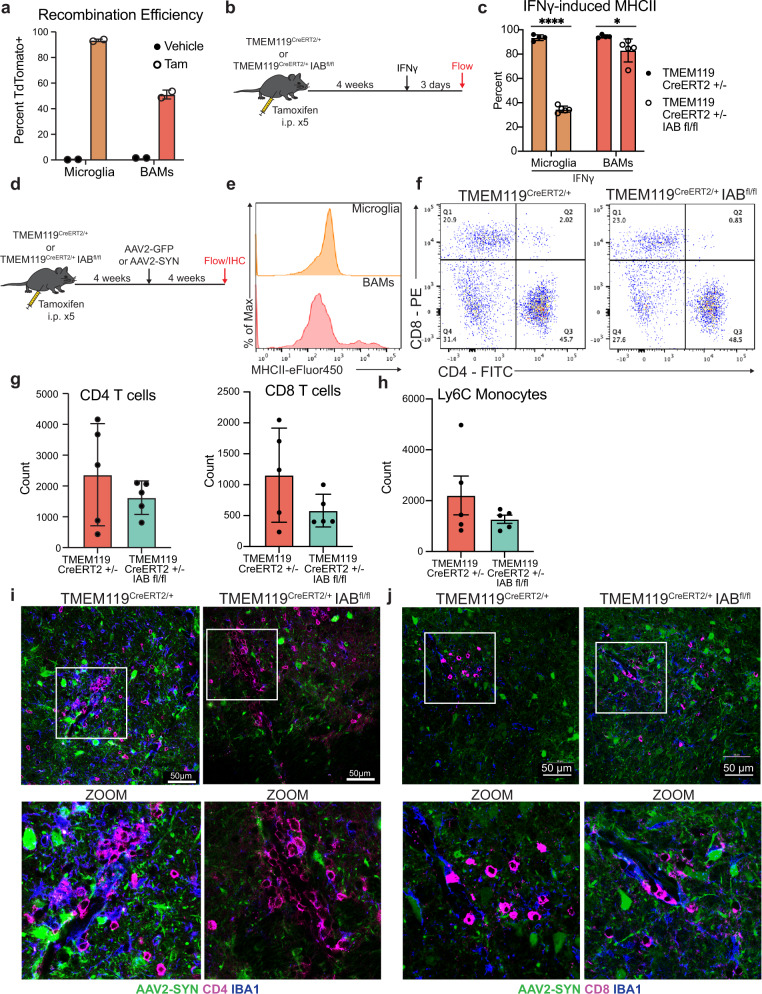
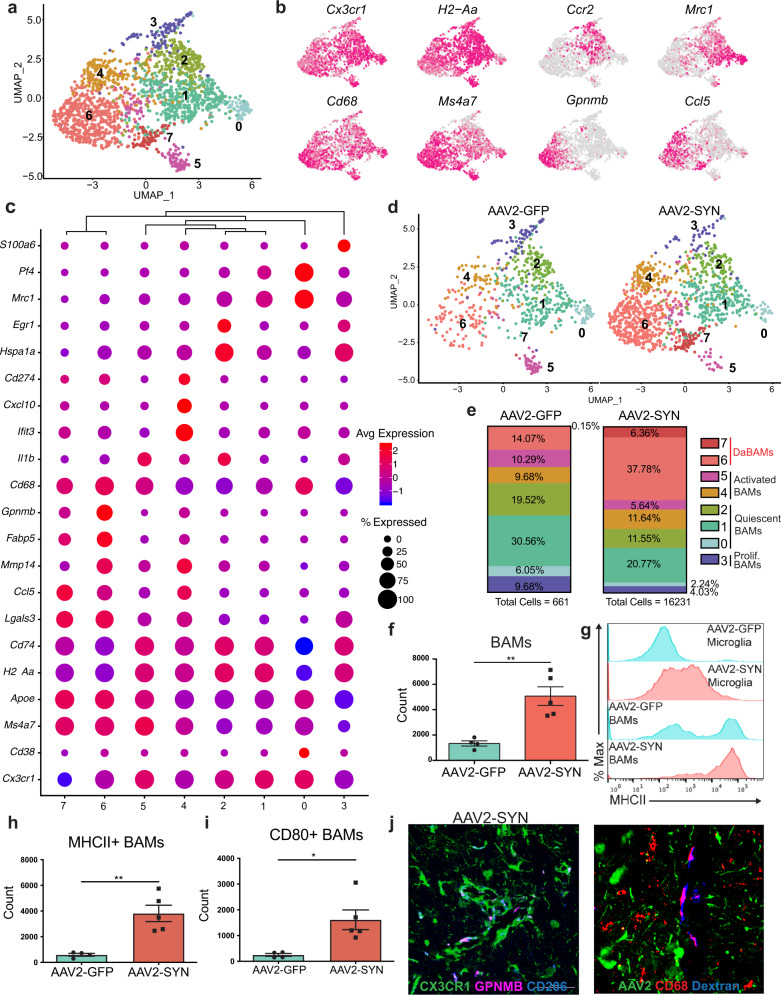
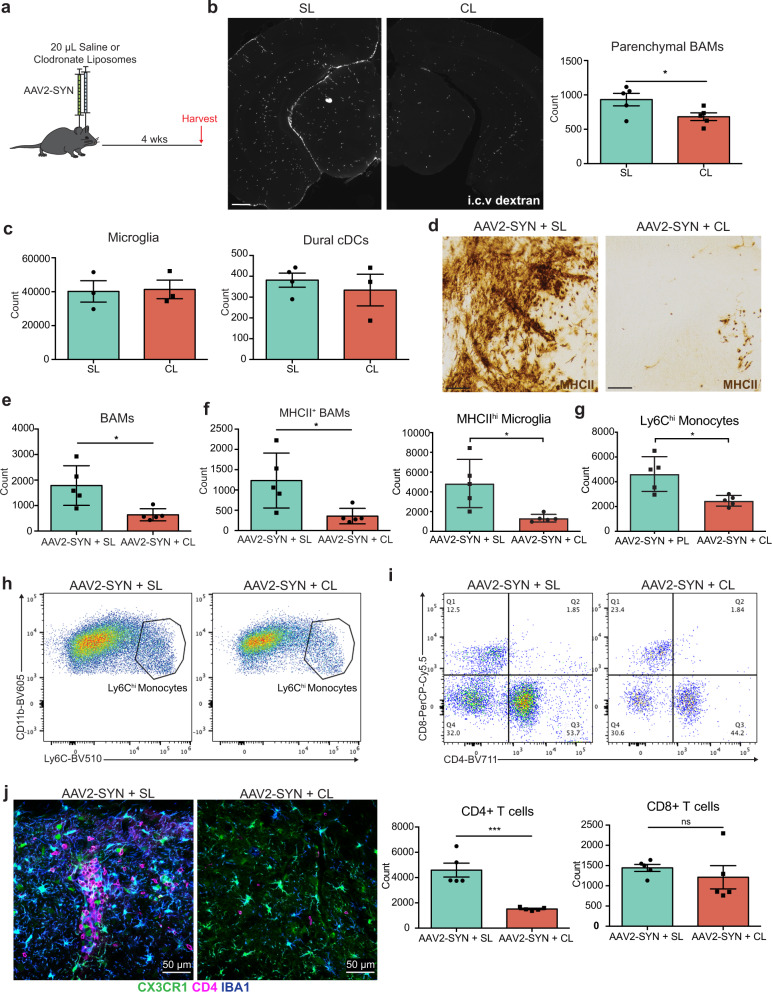
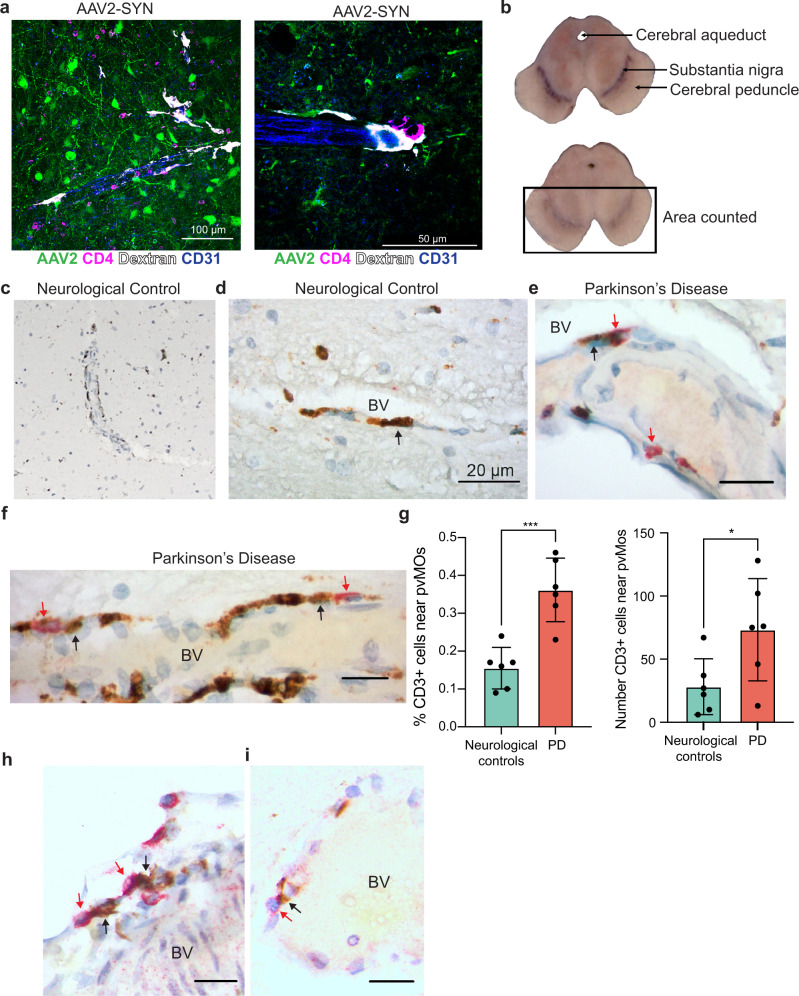
Dopaminergic cell loss due to the accumulation of α-syn is a core feature of the pathogenesis of Parkinson disease. Neuroinflammation specifically induced by α-synuclein has been shown to exacerbate neurodegeneration, yet the role of central nervous system (CNS) resident macrophages in this process remains unclear. We found that a specific subset of CNS resident macrophages, border-associated macrophages (BAMs), play an essential role in mediating α-synuclein related neuroinflammation due to their unique role as the antigen presenting cells necessary to initiate a CD4 T cell response whereas the loss of MHCII antigen presentation on microglia had no effect on neuroinflammation. Furthermore, α-synuclein expression led to an expansion in border-associated macrophage numbers and a unique damage-associated activation state. Through a combinatorial approach of single-cell RNA sequencing and depletion experiments, we found that border-associated macrophages played an essential role in immune cell recruitment, infiltration, and antigen presentation. Furthermore, border-associated macrophages were identified in post-mortem PD brain in close proximity to T cells. These results point to a role for border-associated macrophages in mediating the pathogenesis of Parkinson disease through their role in the orchestration of the α-synuclein-mediated neuroinflammatory response.


Conflict of interest statement

Dr. Standaert has served as a consultant for or received honoraria from Abbvie Inc., Curium Pharma, Appello, Theravance, Sanofi-Aventis, Alnylam Pharmaceutics, Coave Therapeutics, BlueRock Therapeutics, and F. Hoffman-La Roche. All remaining authors declare no competing interests.

Figures

Fig. 1
Fig. 1. CNS resident macrophage antigen presentation mediates neurodegeneration.
a Experimental paradigm for conditional Iab deletion from CX3CR1+ cells. Mice received tamoxifen and 4 weeks later were given AAV2-SYN. Four weeks post AAV2-SYN, flow cytometry and immunohistochemistry were performed. Six months post-AAV, unbiased stereology was performed to quantify neurodegeneration. b Quantification of recombination efficiency of CNS resident macrophages, including microglia (Mg) and border-associated macrophages (BAMs), or meningeal classical dendritic cells (cDCs) 6 weeks after tamoxifen treatment using the CX3CR1CreERT2 mice crossed to TdTomatofl/fl reporter mice. N = 4 mice, unpaired two-tailed T test. *p = 0.0169. Mean ± SEM is displayed. Representative results of two independent experiments are shown. c Quantification of ventral midbrain CD4+ T cells in (d). n = 5 CX3CR1+/− mice and 4 CX3CR1+/− Iab fl/fl mice, **p < 0.01. Mean ± SD is shown. d Representative scans of the ventral midbrain containing the SNpc of DAB staining for CD4+ T cells in CX3CR1CreERT2/+ Iabfl/fl or CX3CR1CreERT2/+ mice. Zoomed images are below showing higher magnification of the boxed area. Numbers indicate if the zoomed image was from CX3CR1CreERT2/+ or CX3CR1CreERT2/+ Iabfl/fl mice. Representative images from two independent experiments are shown. e Immunofluorescent images of CD4+ T cell infiltration in CX3CR1CreERT2/+ Iabfl/fl or CX3CR1CreERT2/+ mice. Brains are labeled with AAV2-SYN (green), CD4 (red) and IBA1 (blue). Images are taken at ×40, scale bar is 50 μm (top) or images are digitally zoomed (bottom). Representative images from two independent experiments are shown. f Representative DAB images of the substantia nigra pars compacta in CX3CR1CreERT2/+ Iabfl/fl or CX3CR1CreERT2/+ mice. Images are labeled with tyrosine hydroxylase (TH), and both the contralateral uninjected (left) and ipsilateral injected (right) sides of the brain are shown. Scale bar is 100 μm. Representative image from one experiment is shown. g Quantification of unbiased stereology of TH+ immunostained neurons in the SNpc of CX3CR1CreERT2/+IABfl/fl or CX3CR1CreERT2/+ control mice who received AAV2-SYN. Quantification is performed at 6 months post AAV transduction and neuron counts are normalized to the average of the group contralateral side. Two-way ANOVA, with Bonferonni multiple comparisons correction, n = 10 mice per group. **p = 0.0053, *p = 0.0105. Mean ± SD is shown. *Source data is provided in the “Source data” file.
Fig. 2
Fig. 2. Alpha-synuclein-specific changes in disease-associated microglia.
a Experimental paradigm for mononuclear cell isolation and single-cell RNA sequencing of brain-resident macrophages, defined by CD45+ CD11b+ Ly6C- CX3CR1+. Mice were injected with AAV2-SYN or AAV2-GFP into the SNpc, and cells were isolated 4 weeks later. b Integrated U-MAP projection of 31,941 cells. In total, eight microglia clusters and one BAM cluster were identified. n = 4 samples, with 3–4 ventral midbrains pooled per sample. c Integrated U-MAP plots colored for expression of microglial and border-associated macrophage identity genes d Integrated U-MAP plots colored for expression of cluster-defining genes. e Dot plot corresponding to the integrated U-MAP plot of brain-resident macrophages demonstrating cluster-identifying genes. Dot size represents the percentage cluster cells expressing the gene and dot color represents its average expression within the cluster. f U-MAP projections of brain-resident macrophage clusters from AAV2-GFP or AAV2-SYN midbrains. N = 2 samples per group, with 3–4 ventral midbrains pooled per sample. g Quantification of relative abundance for each cluster in response to AAV2-GFP or AAV2-SYN. Percentage of total population by each cluster is displayed on graph. Cells are labeled according to their genetic profiles. h KEGG analysis of DAMs (cluster 7) displaying enrichment for processes such as TLR signaling pathways, chemokine signaling, cytokine-cytokine receptor interactions, and phagosome. The Webgestalt online tool with hypergeometric testing and a Benjamini Hochberg correction for multiple tests was used. The top 10 pathways with the most significant p values (under p = 0.05) and 2 or more genes in the group were identified and displayed. i Quantification of flow cytometric data. Microglia were gated as live, CD45+ CD11b+ CX3CR1+ Ly6C- and CD38-. Unpaired T-test, two-tailed, n = 4 AAV2-GFP and 5 AAV2-SYN transduced samples per group with 2 pooled ventral midbrains per sample. Mean ± SD is shown. Representative results of three independent experiments are shown. j Quantification of flow cytometric data investigating MHCIIhi microglia. Unpaired T-test, two-tailed, n = 4 AAV2-GFP and 5 AAV2-SYN transduced samples per group with 2 pooled ventral midbrains per sample. *p = 0.0239. Mean ± SD is shown. Representative results of three independent experiments are shown. *Source data is provided in the “Source data” file.
Fig. 3
Fig. 3. Microglial class II antigen presentation is dispensable for alpha-synuclein-induced T-cell infiltration.
a Fate mapping experiment to determine the baseline and inducible recombination efficiency of CRMs in TMEM119CreERT2/+ TdTomatofl/fl. Percent of cells that are TdTomato+ are displayed. N = 2 mice per treatment group. Mean ± SEM is displayed. Representative results of two independent experiments are shown. b Experimental paradigm designed to test microglial-specific tamoxifen-induced deletion of the Iab locus. Because baseline microglial MHCII expression is low, mice were given intra-nigral IFNγ at 4 weeks post-tamoxifen treatment, and microglial MHCII expression was assayed 3 days post injection. c Quantification of MHCII expression by CRMs, including microglia and BAMs, following IFNγ treatment. Percent of cells expressing MHCII are shown. N = 4 TMEM119 CreERT2/+ and 5 per TMEM119 CreERT2/+ Iab fl/fl mice per group. Two-way ANOVA with Tukey’s multiple comparison test, *p = 0.0291, ****p < 0.0001, mean ± SD is shown. Representative results of one independent experiment are shown. d Experimental paradigm for conditional Iab deletion from TMEM119+ cells. Mice received tamoxifen and 4 weeks later were given AAV2-SYN. Four weeks post AAV2-SYN, flow cytometry and immunohistochemistry were performed. e Representative histograms displaying MHCII expression on microglia and BAMs in AAV2-GFP and AAV2-SYN conditions. Y axis represents percent of maximum to allow comparison between differently sized populations. X axis displays MHCII intensity. f Representative flow plots of brain-infiltrating CD4+ or CD8+ T cells in TMEM119CreERT2/+ IABfl/fl mice or TMEM119CreERT2/+ control mice. Representative results from one independent experiment. g Quantification of (f). n = 5 per group, with one ventral midbrain per n. Mean ± SD is shown. h Quantification of infiltrating Ly6C hi monocytes in TMEM119CreERT2/+ IABfl/fl mice or TMEM119CreERT2/+ control mice 4 weeks after AAV2-SYN. N = 5 per group, with one ventral midbrain per n. Mean ± SD is shown. Representative results from one independent experiment. i Immunofluorescent images of CD4+ T cell infiltration in TMEM119CreERT2/+ IABfl/fl mice or TMEM119CreERT2/+ control mice. Tissues are labeled with CD4 (magenta), AAV2-SYN (green), and IBA1 (blue). Images taken at ×40 magnification (top) and digitally zoomed (bottom). Representative images from one experiment are shown and meant to corroborate flow cytometry results. j Immunofluorescent images of CD8+ infiltration in TMEM119CreERT2/+ IABfl/fl mice or TMEM119CreERT2/+ control mice. Tissues are labeled with CD8 (magenta), AAV2-SYN (green), and IBA1 (blue). Images taken at ×40 magnification (top) and digitally zoomed (bottom). Representative images from one experiment are shown and meant to corroborate flow cytometry results. *Source data is provided in the “Source data” file.
Fig. 4
Fig. 4. Alpha-synuclein specific changes in border-associated macrophages.
a Cluster 8 from the larger dataset was isolated and subjected to unbiased clustering. Displayed are integrated BAM U-MAP plots colored for expression of genes specifically upregulated in key BAM clusters. b Integrated U-MAP plots colored for expression of BAM identity genes and cluster defining genes. c Dot plot corresponding to the integrated U-MAP plot of BAMs demonstrating cluster-identifying genes. Dot size represents the percentage cluster cells expressing the gene and dot color represents its average expression within the cluster. d U-MAP projections demonstrating BAM cluster changes with AAV2-SYN compared to AAV2-GFP. Overall, eight distinct BAM clusters were identified. e Proportion of the total cells in each BAM cluster in response to AAV2-GFP or AAV2-SYN. Cells are labeled according to their genetic profiles. f Quantification of flow cytometric data. BAMs were gated as live, CD45+ CD11b+ CX3CR1+ Ly6C- and CD38+. Unpaired T-test, two-tailed, n = 4 AAV2-GFP and 5 AAV2-SYN transduced samples per group, with 2 pooled ventral midbrains per sample. **p = 0.0033. Mean ± SD is shown. Representative results from three independent experiments. g Representative histograms (left) displaying MHCII expression on microglia and BAMs in AAV2-GFP and AAV2-SYN conditions. Y axis represents percent of maximum to allow comparison between differently sized populations. X axis displays MHCII intensity. h Flow cytometric quantification of MHCII on BAMs. BAMs are gated as live, CD45+ CD11b+ CX3CR1+ Ly6C- and CD38+. Unpaired T-test, two-tailed, n = 4 AAV2-GFP and 5 AAV2-SYN transduced samples per group, with 2 pooled ventral midbrains per sample. **p = 0.003. Mean ± SD is shown. Representative results from three independent experiments. i Flow cytometric quantification of CD80 on BAMs. BAMs are gated as live, CD45+ CD11b+ CX3CR1+ Ly6C- and CD38+. Unpaired T-test, two-tailed, n = 4 AAV2-GFP and 5 AAV2-SYN transduced samples per group, with 2 pooled ventral midbrains per sample. *p = 0.0167. Mean ± SD is shown. Representative results from two independent experiments are shown. j Immunofluorescence confirming expression of GPNMB and CD68 in perivascular BAMs. Tissue is labeled with CX3CR1 (green), GPNMB (left) or CD68 (right) (magenta), and Cd206 (blue). Images are taken at ×60 magnification. Representative images are shown from one experiment and corroborate scRNA sequencing and flow cytometry findings. *Source data is provided in the “Source data” file.
Fig. 5
Fig. 5. Specific depletion of border-associated macrophages prevents alpha-synuclein induced neuroinflammation.
a Experimental paradigm for Clodronate Liposome (CL) BAM depletion in combination with AAV2-SYN administration. Flow cytometry and IHC are performed 4 weeks post administration. b Left: Tiled fluorescent images demonstrating BAM depletion within the ventral midbrain 7 days after CL or Saline Liposome (SL) administration. BAMs are marked with dextran that was administered i.c.v. 24 h prior to sacrifice (white). Right: flow cytometric quantification of BAM depletion with CL. BAMs are gated as live, CD45+ CD11b+ CX3CR1+ Ly6C- and CD38+. Scale bar is 500 µm. Unpaired T-test, two-tailed, n = 5 samples per group with 2 ventral midbrains pooled per sample. *p = 0.0466. Mean ± SD is shown. Representative results from two independent experiments. c Flow cytometric quantification 7 days post CL or SL administration demonstrating that parenchymal microglia (N = 3 samples per group) and dural cDCs (N = 4 SL and 3 CL samples per group) are unaffected with treatment. Each sample comprised of 2 pooled ventral midbrains. Mean ± SD is shown. Representative results from two independent experiments. d Immunohistochemistry depicting MHCII (brown) expression within the ventral midbrain after AAV2-SYN + SL or AAV2-SYN + CL, demonstrating that BAM depletion prevents MHCII expression in the midbrain. Displayed images are cropped from larger tiled ones. Scale bar is 50 µm. Representative images are displayed from two independent experiments. e Confirmation of BAM depletion in AAV2-SYN with CL via flow cytometry. Unpaired T-test, two-tailed, n = 5 per group. *p = 0.0134. Mean ± SD is shown. Representative results from two independent experiments. f Flow cytometric quantification of MHCII+ BAM and MHCII+ microglia reduction with CL treatment. Unpaired T-test, two-tailed, n = 5 per group. *p = 0.0238 and 0.013, respectively. Mean ± SD is shown. Representative results from two independent experiments. g Quantification of infiltrating Ly6Chi monocytes in response to α-syn. Monocytes are gated as live, CD45+ CD11b+ CX3CR1- CD38- Ly6Chi. Unpaired T-test, two-tailed, n = 5 per group. *p = 0.011. Mean ± SD is shown. Representative results from two independent experiments. h Representative flow plots of (g). i Top: Representative flow plots of CD4+ and CD8+ T cell infiltration with SL or CL treatment. Below: Quantification of flow cytometry demonstrating that BAM depletion reduces CD4+ T cell infiltration. Unpaired T-test, two-tailed, n = 5 per group. ***p = 0.0005. Mean ± SD is shown. Representative results from two independent experiments. j Immunofluorescent images demonstrating reduced CD4+ T cell infiltration and myeloid activation with CL-mediated BAM depletion. Tissues are labeled with CX3CR1 (green), CD4 (magenta), and IBA1 (blue). Images were captured at ×40. *Source data is provided in the “Source data” file.
Fig. 6
Fig. 6. Border-associated macrophages in human PD.
a Immunofluorescence showing abundance of close interactions between CD4+ T cells and perivascular macrophages in the mouse SNpc. Tissue is labeled with AAV2-SYN (green), CD4 (magenta), Dextran (white), and CD31 (blue). Images are taken at ×40 (left) and ×60 (right). b Transverse sections of midbrains from one neurological control (top) and one patient with PD (bottom), showing the anatomic landmarks of the cerebral aqueduct, substantia nigra, and cerebral peduncle. Rectangle denotes the region of interest where CD3/CD68 double immunostaining was counted. c Images of CD68+ BAMs located in the perivascular space of the substantia nigra of non-neurological disease controls, demonstrating their abundance in human brains. d High magnification demonstrating elongated, vessel-localized CD68+ BAMs in the non-neurological disease control substantia nigra. Black arrows point to BAMs. BV denotes the blood vessel. Scale bar is 20 μm. e Vessel-localized CD68+ BAMs (brown) and CD3+ T cells (red) in the substantia nigra of human PD (right). Black arrows denote BAMs, red arrows denote CD3+ T cells. BV indicates the blood vessel. Scale bars are 10 μm. f Vessel-localized CD68+ BAMs (brown) and CD3+ T cells (red) in the substantia nigra of human PD (right). Black arrows denote BAMs, red arrows denote CD3+ T cells. BV indicates the blood vessel. Scale bars are 10 μm. g Quantification of BAM – T cell interactions in human PD. The percentage of perivascular CD3+ cells adjacent to perivascular CD68+ cells was divided by the total number of CD3+ cells in the ventral midbrain of 6 DLBD patients and 6 controls. Graph displays mean values ± SD. Unpaired T test, two-sided, *p = 0.0375, ***p = 0.0005. Mean ± SD is shown. h Vessel-localized CD8+ T cells (red) and CD68+ BAMs (brown) cells in the substantia nigra of human PD. Black arrows denote BAMs, whereas red arrows denote CD8+ T cells that are in close proximity to BAMs. BV denotes blood vessel. Scale bars are 10 μm. Representative images of one experiment are displayed. i Vessel-localized CD4+ T cells (red) and CD68+ BAMs (brown) cells in the substantia nigra of human PD. Black arrows denote BAMs, red arrows denote CD4+ T cells BV denotes blood vessel. Scale bars are 10 μm. Representative images of one experiment are displayed. *Source data is provided in the “Source data” file.

Comment in

References

    1. Paolicelli RC, et al. Microglia states and nomenclature: a field at its crossroads. Neuron. 2022;110:3458–3483. doi: 10.1016/j.neuron.2022.10.020. - DOI - PMC - PubMed
    1. Schonhoff AM, Williams GP, Wallen ZD, Standaert DG, Harms AS. Innate and adaptive immune responses in Parkinson’s disease. Prog. Brain Res. 2020;252:169–216. doi: 10.1016/bs.pbr.2019.10.006. - DOI - PMC - PubMed
    1. Devos D, et al. Colonic inflammation in Parkinson’s disease. Neurobiol. Dis. 2013;50:42–48. doi: 10.1016/j.nbd.2012.09.007. - DOI - PubMed
    1. Chen H, et al. Nonsteroidal antiinflammatory drug use and the risk for Parkinson’s disease. Ann. Neurol. 2005;58:963–967. doi: 10.1002/ana.20682. - DOI - PubMed
    1. Brochard V, et al. Infiltration of CD4+ lymphocytes into the brain contributes to neurodegeneration in a mouse model of Parkinson disease. J. Clin. Investig. 2009;119:182–192. - PMC - PubMed

Publication types

Substances