. 2023 Jun 26;13(1):10366.
doi: 10.1038/s41598-023-36983-8.

Estimation of maximal lactate steady state using the sweat lactate sensor

Affiliations

Estimation of maximal lactate steady state using the sweat lactate sensor

Yuki Muramoto et al. Sci Rep. .

Abstract

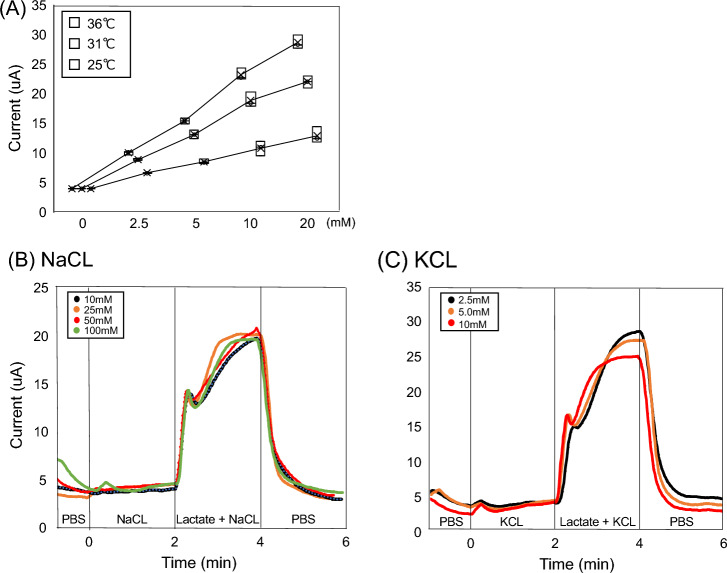
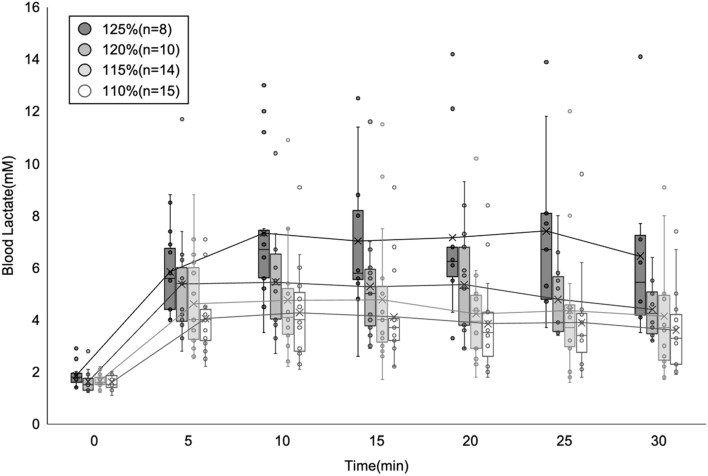
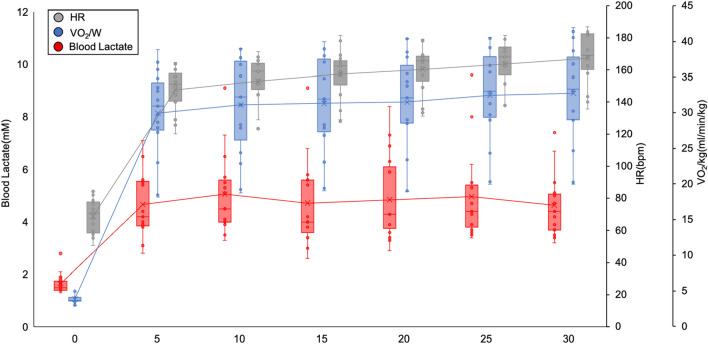
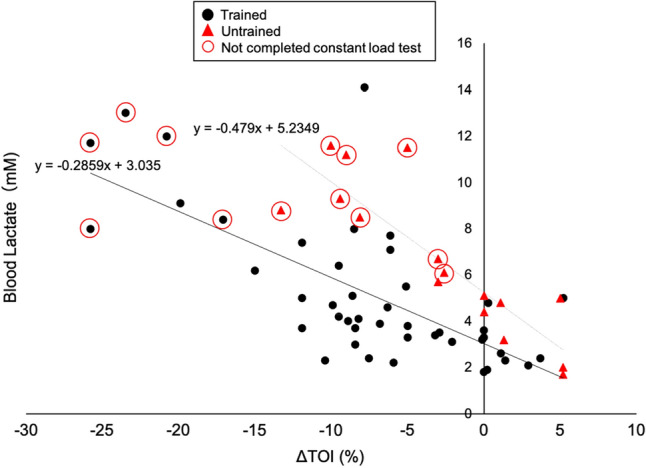
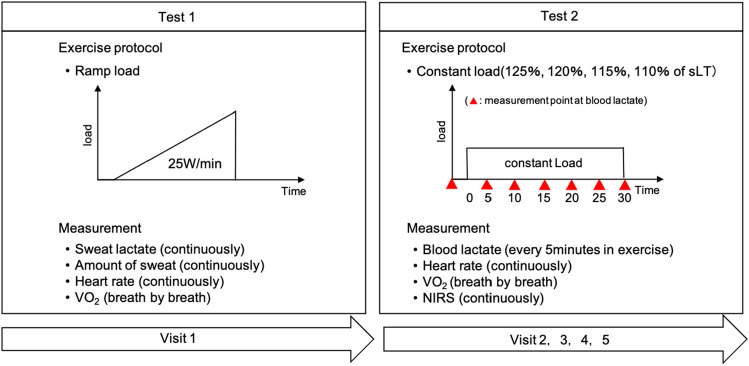
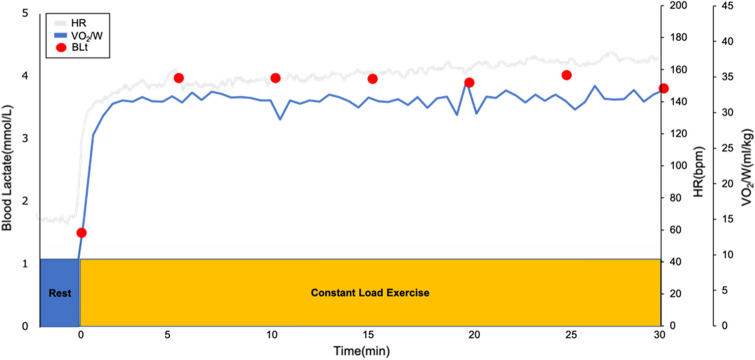
A simple, non-invasive algorithm for maximal lactate steady state (MLSS) assessment has not been developed. We examined whether MLSS can be estimated from the sweat lactate threshold (sLT) using a novel sweat lactate sensor for healthy adults, with consideration of their exercise habits. Fifteen adults representing diverse fitness levels were recruited. Participants with/without exercise habits were defined as trained/untrained, respectively. Constant-load testing for 30 min at 110%, 115%, 120%, and 125% of sLT intensity was performed to determine MLSS. The tissue oxygenation index (TOI) of the thigh was also monitored. MLSS was not fully estimated from sLT, with 110%, 115%, 120%, and 125% of sLT in one, four, three, and seven participants, respectively. The MLSS based on sLT was higher in the trained group as compared to the untrained group. A total of 80% of trained participants had an MLSS of 120% or higher, while 75% of untrained participants had an MLSS of 115% or lower based on sLT. Furthermore, compared to untrained participants, trained participants continued constant-load exercise even if their TOI decreased below the resting baseline (P < 0.01). MLSS was successfully estimated using sLT, with 120% or more in trained participants and 115% or less in untrained participants. This suggests that trained individuals can continue exercising despite decreases in oxygen saturation in lower extremity skeletal muscles.


Conflict of interest statement

No funding was received to conduct this study. Daisuke Nakashima is the shareholder and CEO of Grace Imaging Inc., which provided the lactate sensor equipment. The other authors declare no competing interests.

Figures

Figure 1
Figure 1
In-vitro characterization of the lactate sensor under imitated sweat environments. (A) The graph shows the corresponding calibration plots of the sensor with pH 7 under different temperature (25, 31, and 36 °C) conditions. The interference study for individual lactate (B,C). The presence of non-target electrolytes; Na, K, and Cl cause negligible interference to the response of our lactate sensors. Applied voltage = 0.16 V versus Ag/AgCl. The data were obtained from three samples.
Figure 2
Figure 2
Blood lactate for participants who were able to exercise at each load.
Figure 3
Figure 3
Blood lactate, heart rate, VO2/kg at the MLSS in all participants (n = 15). Blood lactate (red), heart rate (gray), and oxygen uptake-adjusted weight (blue) at the MLSS in each participant. MLSS maximal lactate steady state, VO2/kg oxygen uptake/weight.
Figure 4
Figure 4
Correlation between change in tissue oxygenation index (TOI) and blood lactate. The black circle represents trained participants, who showed a good correlation between ΔTOI and blood lactate level (y = −0.2859x + 3.035, r = −0.7, P < 0.01). The red triangle represents untrained participants, who showed a good correlation between ΔTOI and blood lactate (y = −0.479x + 5.2349, r = −0.8, P < 0.01). A steeper increase in blood lactate level was associated with a decrease in ΔTOI in untrained participants as compared to trained participants. ΔTOI TOI (pre-post).
Figure 5
Figure 5
Difference in ΔTOI between trained and untrained participants in the completed exercise. Trained participants continued constant-load exercise even if their ΔTOI decreased (mean difference: −7.4, 95% confidence interval: −11.4 to −3.4, P < 0.01). ΔTOI TOI (pre-post); *: P < 0.05.
Figure 6
Figure 6
Flowchart of the study protocol. NIRS near-infrared spectrometer, VO2 oxygen uptake.
Figure 7
Figure 7
Sweat lactate levels during ramp exercise. HR heart rate, VO2/W oxygen uptake/weight.
Figure 8
Figure 8
Imaging of the constant-load exercise. HR heart rate, VO2/W oxygen uptake/weight, BLt blood lactate.

References

    1. Faude O, Kindermann W, Meyer T. Lactate threshold concepts: How valid are they? Sports Med. 2009;39:469–490. doi: 10.2165/00007256-200939060-00003. - DOI - PubMed
    1. Beneke R. Methodological aspects of maximal lactate steady state-implications for performance testing. Eur. J. Appl. Physiol. 2003;89:95–99. doi: 10.1007/s00421-002-0783-1. - DOI - PubMed
    1. Azevedo RA, Forot J, Millet GY, Murias JM. Comparing of muscle V̇O2 from near-infrared spectroscopy desaturation rate to pulmonary V̇O2 during cycling below, at, and above the maximal lactate steady state. J. Appl. Physiol. 2022;132:641–652. doi: 10.1152/japplphysiol.00754.2021. - DOI - PubMed
    1. Garcia-Tabar I, Gorostiaga EM. A “blood relationship” between the overlooked minimum lactate equivalent and maximal lactate steady state in trained runners. Back to the old days? Front. Physiol. 2018;9:1034. doi: 10.3389/fphys.2018.01034. - DOI - PMC - PubMed
    1. Greco CC, Barbosa LF, Caritá RA, Denadai BS. Is maximal lactate steady state during intermittent cycling different for active compared with passive recovery? Appl. Physiol. Nutr. Metab. 2012;37:1147–1152. doi: 10.1139/h2012-105. - DOI - PubMed