. 2023 Jul;26(7):1208-1217.
doi: 10.1038/s41593-023-01361-0. Epub 2023 Jun 26.

Multi-level analysis of the gut-brain axis shows autism spectrum disorder-associated molecular and microbial profiles

Affiliations

Multi-level analysis of the gut-brain axis shows autism spectrum disorder-associated molecular and microbial profiles

James T Morton et al. Nat Neurosci. 2023 Jul.

Abstract

Autism spectrum disorder (ASD) is a neurodevelopmental disorder characterized by heterogeneous cognitive, behavioral and communication impairments. Disruption of the gut-brain axis (GBA) has been implicated in ASD although with limited reproducibility across studies. In this study, we developed a Bayesian differential ranking algorithm to identify ASD-associated molecular and taxa profiles across 10 cross-sectional microbiome datasets and 15 other datasets, including dietary patterns, metabolomics, cytokine profiles and human brain gene expression profiles. We found a functional architecture along the GBA that correlates with heterogeneity of ASD phenotypes, and it is characterized by ASD-associated amino acid, carbohydrate and lipid profiles predominantly encoded by microbial species in the genera Prevotella, Bifidobacterium, Desulfovibrio and Bacteroides and correlates with brain gene expression changes, restrictive dietary patterns and pro-inflammatory cytokine profiles. The functional architecture revealed in age-matched and sex-matched cohorts is not present in sibling-matched cohorts. We also show a strong association between temporal changes in microbiome composition and ASD phenotypes. In summary, we propose a framework to leverage multi-omic datasets from well-defined cohorts and investigate how the GBA influences ASD.


Conflict of interest statement

R.H.M. is Scientific Director at Precidiag, Inc. T.D.L. is a co-founder and Chief Scientific Officer of Microbiotica. S.K.M. is a co-founder and has equity in Axial Therapeutics. R.J.X. is a co-founder of Celsius Therapeutics and Jnana Therapeutics, a member of the Scientific Advisory Board at Nestle and a member of the Board of Directors at Moonlake Immunotherapeutics. R.B. is currently Executive Director of Prescient Design, a Genentech Accelerator. J.T.M. is the founder of Gutz Analytics and a co-founder of Integrated Omics AI. G.T.-O. is a Consultant-in-Residence at the Simons Foundation. The remaining authors declare no competing interests.

Figures

Fig. 1
Fig. 1. Diagram delineating the concept of age matching and sex matching.
a, Children with ASD and neurotypical children of the same gender and similar age (±6 months) were matched within studies to reduce batch effects due to experimental and other cohort-specific differences. Matched pairs were then used to compute differentials (log fold ratios) of different omic features (microbes, metabolites, etc.). Downstream analyses across studies compared the within-study differentials determined for the different pairs of matched individuals (numbers inside circles denote age in years). b, The structure of our meta-analysis across multiple omic levels. For Fig. 2, 16S differentials computed from age-matched and sex-matched cohorts were cross-referenced against 16S differentials from sibling-matched cohorts as well as against SMS differentials from other age-matched and sex-matched cohorts. For Fig. 3, the 16S differentials from the age-matched and sex-matched cohorts were cross-referenced against cytokine differentials and RNA-seq differentials using KEGG pathways as a reference. Figure 3 also includes a microbe–diet co-occurrence analysis. For Fig. 4, the 16S differentials from the age-matched and sex-matched cohorts were cross-referenced against 16S differentials computed from the Kang et al. FMT trial.
Fig. 2
Fig. 2. Differential ranking analysis across omics levels.
a, Global microbial 16S log fold changes between age-matched and sex-matched ASD and control individuals. Error bars represent the 95% credible intervals. Heat map showing all center log ratio (CLR) transformed microbial differentials for each age-matched and sex-matched ASD–control pair across all cohorts. Microbes are binned into ASD-associated, Neutral and Control-associated groups using an age-matched and sex-matched classifier (Methods). K is an unknown bias due to the shift in the microbial load between the ASD and neurotypical control population. b, Sample size, male:female (M:F) ratio and average ages across all 16S and shotgun metagenomics datasets analyzed in this study and held-out gradient boosting ASD prediction performance measured by AUROC. V3–V4, V4 and V4–V5 refer to the variable region of the bacterial ribosomal RNA analyzed. c, Log ratios of microbes that are classified to be ASD associated and control associated were computed for each sample. The x axis represents the case–control differences of these log ratios, where values greater than 0 indicate that there is a separation between children with ASD and neurotypical children. The box plots show the median (line), 25–75% range (box) and 5–95% range (whiskers). d, Effect sizes of different omics levels: viral, 16S, SMS and RNA-seq.
Fig. 3
Fig. 3. Characterizing the associations among differentially abundant microbes in ASD and cytokines, gene expression in the brain and dietary patterns.
a,b, Comparison of microbial differentials obtained from age matching and sex matching and cytokine analysis. c,d, Microbial log ratios constructed from the 50 top and bottom most differentially abundant microbes corresponding to each cytokine. K and C represent unknown biases due to the shift in the microbial load between the ASD and neurotypical control population. e, Heat map showing the overlap of molecules between ASD-enriched pathways in the microbiome and in the brain. The microbial and human pathways are both sorted alpha-numerically; the dense diagonal is largely indicative of common pathways between microbial and human genomes. f,g, PC3 from microbe–diet co-occurrence analysis is contrasted against microbial log fold changes and dietary differences from Berding et al. Dietary compounds that are depleted (P < 0.1) in children with ASD are highlighted as ‘x’ markers. T(ASD-Control) represents the t-statistic that measures the differences between ASD and neurotypical dietary intake. conc., concentration.
Fig. 4
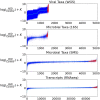
Fig. 4. FMTs have long-lasting effects on autism gut microbiomes.
a, The improvement of CARS for each child with ASD over time. The children were split into three groups—non-ASD, mild/moderate and severe—based on whether their CARS score fell below 30, was between 30 and 37 or was higher than 37. b, Microbial log fold changes over time: the time series was generated by calculating log fold changes between timepoints for each microbe. ASD-specific microbes highlighted in red were determined in the cross-sectional study. cf, Microbial log fold changes are re-colored with genera highlighted in cytokine comparisons.
Extended Data Fig. 1
Extended Data Fig. 1. Study approach.
Metagenomic sequence data present unique quantification challenges due to a lack of total microbial load measurements, which precludes the determination of absolute microbe abundances, and to limitations brought about by sampling and sequencing depth limitations, which result in an incomplete representation of the metagenome. We devised a Bayesian differential ranking algorithm to address both these challenges, the compositional challenge and the zero-inflation challenge. The compositional challenge: Most sequencing count datasets lack absolute abundance information in the form of cells, colony forming units, or transcripts per volume. This limitation preempts the reliable estimation of log fold changes (LFCs) and is a defining characteristic of compositional data that can lead to excessive false positives or false negatives depending on the magnitude of the change in absolute abundances. As illustrated in panels a) through c), microbial counts (a) are typically converted into proportional abundances (b) that are then used to compute log-fold ratios. Fold change calculations adopt the general formula BA=NBpBNApA=pBpA×NBNA, where A and B represent the two samples being compared, pA and pB represent the microbial proportions in A and B, and NA and NB represent the total number of microbes in A and B, also known as the ground truth. A key limitation of sequencing count data is their lack of proportionality to the corresponding absolute abundances in the original samples due to sequencing depth constraints. Our inability to observe NA and NB introduces a bias that ultimately prevents us from performing false discovery rate (FDR) correction to identify differentially abundant microbes. This bias depends on the change in microbial population size, with large population shifts leading to increased false positive and false negative rates, and an overall skewed representation of the ground truth (c). The zero-inflation challenge: Sampling errors and shallow sequencing lead to disproportionately high numbers of zero counts, especially for microbes present in low abundances (d). Multinomial, Poisson and Negative Binomial distributions have been used to explicitly handle zero counts. However, estimating log-fold differentials remains problematic when microbes are not observed in any of the samples in one group since log 0 is −  and thus the true log-fold change of a zero-count microbe can not be determined (e). Bayesian inference avoids this problem by introducing a prior that prevents nonsensical log-fold change estimates (f). Specifically, this introduces a rounded-zero assumption whereby all microbes have a non-zero chance of being observed. Panel h highlights what these log-fold changes would look like using a Dirichlet prior, where every microbe has the same probability of being observed before collecting data.
Extended Data Fig. 2
Extended Data Fig. 2. Benchmarks.
(a-d) Mean and standard deviations of the per-microbe log-fold changes compared to the total sequencing depth (log10 scale) for each microbe. e) Rarefaction benchmark, showcasing how differential abundance analysis is insensitive to rarefaction. (f) Differential abundance estimation derived from a data-driven simulated 16S dataset. (g) Comparison of age- and sex-matching approach compared to standard group averaging with respect to dataset size across 7 of the 11 16S studies (excluding Kang et al, David et al and Son et al The x-axis represents the number of aggregated datasets, the y-axis on the left panel is the average R2 metric to measure the model error. (h) Number of samples analyzed on the y-axis, and the x-axis on the right panel is the number of aggregated dataset. (i-k) Simulated datasets with a sequencing depth differential between matched cases and controls, where matched controls always have a larger sequencing depth than their case counterparts. This benchmark investigates how well ANCOM-BC, group averaged differential ranking and age-sex matched differential ranking can recover the ground truth log-fold changes. The group averaged and age-sex matched differential ranking both use the Negative Binomial (NB) distribution to model sequencing count data.(l-m) Simulated datasets comparing household matching to age-sex matching. (l-n) Bray-Curtis PCoA of 2 samples replicated across 4 processing labs in the MBQC. (m) Pairwise comparsions of log-fold change between 2 samples across all 4 labs using group-averaged differential abundance analysis.
Extended Data Fig. 3
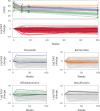
Extended Data Fig. 3. Differential ranking trends observed for the virome, 16S, SMS, and RNAseq datasets analyzed in this study.
The top 10% most differentially abundant features are highlighted in red. The x axis for the virome, 16S and SMS datasets is equivalent to showcase the differences in feature counts; the x axes for the RNAseq dataset is larger by a factor of 10, illustrating the stark difference in number of features of this dataset compared to the other three.
Extended Data Fig. 4
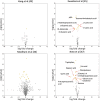
Extended Data Fig. 4. Metabolomics differential ranking analysis across four studies.
Paired t-tests were performed to identify differentially abundant metabolites. The metabolites shown in Needham et al consist of both fecal and serum metabolites. None of the metabolites had significant log-fold changes after applying FDR correction.
Extended Data Fig. 5
Extended Data Fig. 5. Comparison of log-fold changes computed from 16S and SMS.
(a) Comparison of taxa proportions across all 16S and SMS samples from Dan et al the cross-sectional datasets after mapping to Greengenes2. (b) Comparison of differentials obtained from 16S and SMS on the same samples from Dan et al across taxa observed in both datasets. Only log-fold changes with high confidence (std < 0.5) are shown here.
Extended Data Fig. 6
Extended Data Fig. 6. Age differences between case-control matchings.
(a) 16S age-sex matched dataset, (b) the SMS age-sex matched dataset, (c) the David et al household matched dataset (16S) (d) the Son et al household matched dataset (16S) all datasets, the age of the control subject is subtracted from the age of the corresponding matched ASD subject. Neither David et al or Son et al showed a statistical difference between ages across households. (e) Estimated microbial log-fold changes compared to ground truth microbial log-fold changes in household matched simulation. (f) Estimated microbial log-fold changes compared to ground truth microbial log-fold changes in age-sex matched simulation. (g) Percentage of case-control pairs that are within 1 year in the age-sex matched dataset and the sibling matched dataset. (h) Percentage of case-control pairs that are have the same gender in the age-sex matched dataset and the sibling matched dataset.
Extended Data Fig. 7
Extended Data Fig. 7. Microbe-viral co-occurrence network estimated using MMvec.
Microbes are colored red and viruses are colored blue. Edges are drawn between microbes and viruses if they are highly co-occurring and the interaction was annotated in GPD.
Extended Data Fig. 8
Extended Data Fig. 8. Microbe-diet co-occurrences.
Microbe-diet co-occurrence heatmaps sorted by the (a) first and (b) third principal components estimated from MMvec.
Extended Data Fig. 9
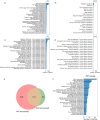
Extended Data Fig. 9. Distribution of pathways in ASD and control-associated genes detected in SMS and RNAseq data.
(a-b) Breakdown of pathways in SMS data that are associated with ASD and neurotypical controls. (c-d) Breakdown of pathways in RNAseq data that are associated with ASD and neurotypical controls. e) Overlap of ASD associated KEGG enzymes derived from the multi-cohort cross-sectional analysis and KEGG enzymes that are found to be present in the microbes that decreased in the Kang et al FMT study. f) Pathway break down of KEGG enyzmes found in both the Kang et al FMT study and ASD children in the multi-cohort cross-sectional analysis. Only microbes that were also found in the SMS data were considered in the Kang et al study.

References

    1. Lord C, et al. Autism spectrum disorder. Nat. Rev. Dis. Primers. 2020;6:5. doi: 10.1038/s41572-019-0138-4. - DOI - PMC - PubMed
    1. Satterstrom FK, et al. Large-scale exome sequencing study implicates both developmental and functional changes in the neurobiology of autism. Cell. 2020;180:568–584. doi: 10.1016/j.cell.2019.12.036. - DOI - PMC - PubMed
    1. Iakoucheva LM, Muotri AR, Sebat J. Getting to the cores of autism. Cell. 2019;178:1287–1298. doi: 10.1016/j.cell.2019.07.037. - DOI - PMC - PubMed
    1. Schumann CM, et al. The amygdala is enlarged in children but not adolescents with autism; the hippocampus is enlarged at all ages. J. Neurosci. 2004;24:6392–6401. doi: 10.1523/JNEUROSCI.1297-04.2004. - DOI - PMC - PubMed
    1. Lefter R, Ciobica A, Timofte D, Stanciu C, Trifan A. A descriptive review on the prevalence of gastrointestinal disturbances and their multiple associations in autism spectrum disorder. Medicina (Kaunas) 2019;56:11. doi: 10.3390/medicina56010011. - DOI - PMC - PubMed

Publication types