. 2023 Jul;4(7):984-1000.
doi: 10.1038/s43018-023-00584-1. Epub 2023 Jun 26.

Interferon signaling promotes tolerance to chromosomal instability during metastatic evolution in renal cancer

Affiliations

Interferon signaling promotes tolerance to chromosomal instability during metastatic evolution in renal cancer

Luigi Perelli et al. Nat Cancer. 2023 Jul.

Abstract

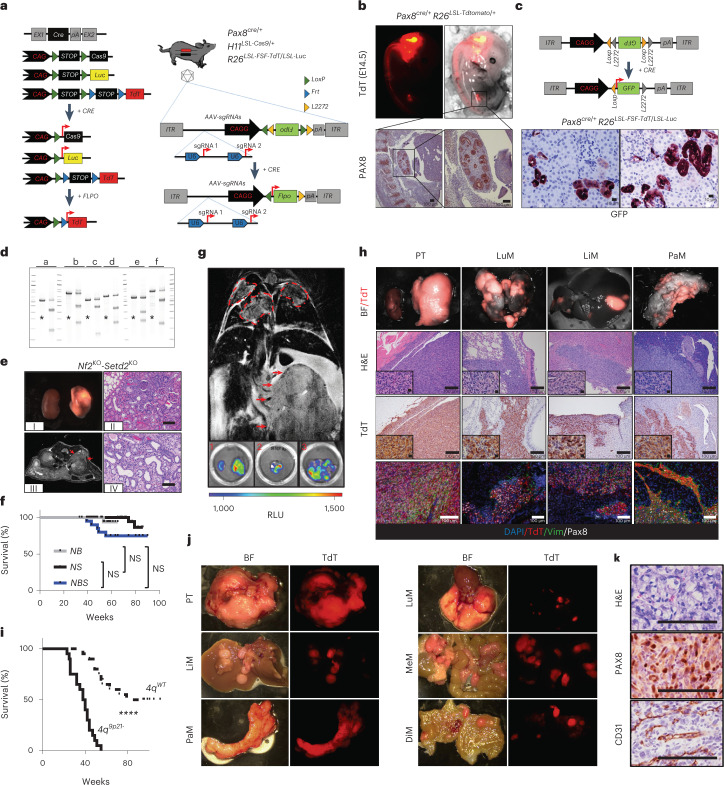
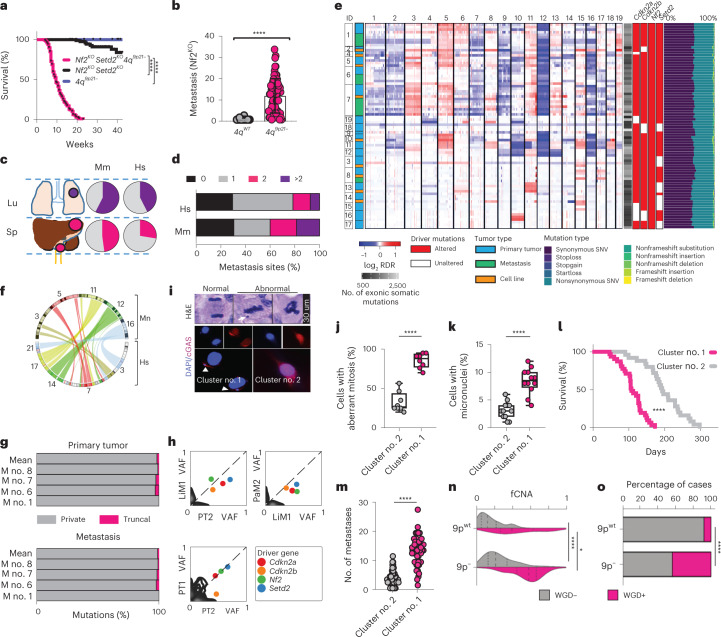
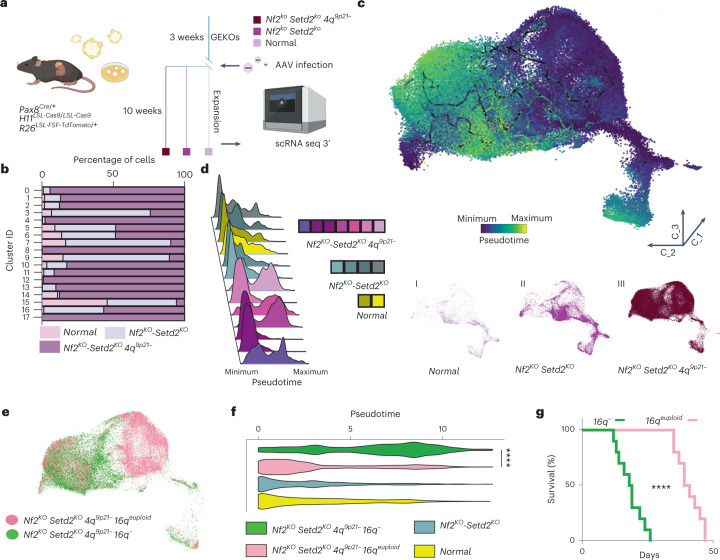
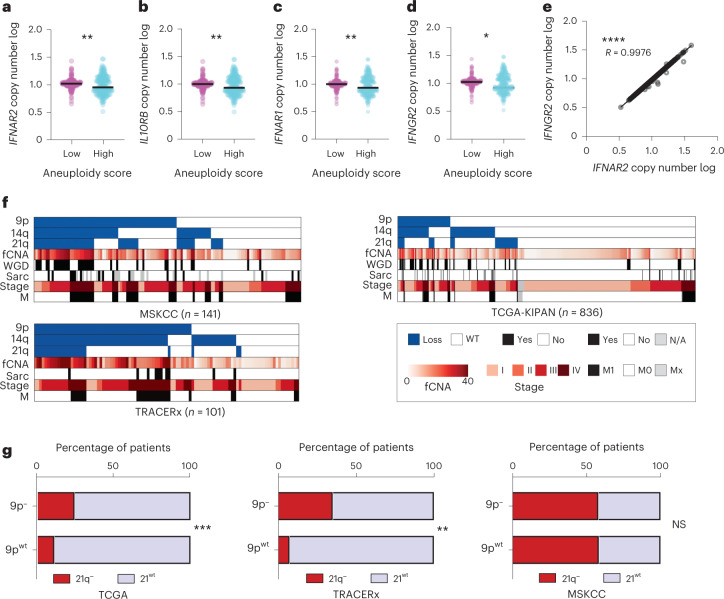
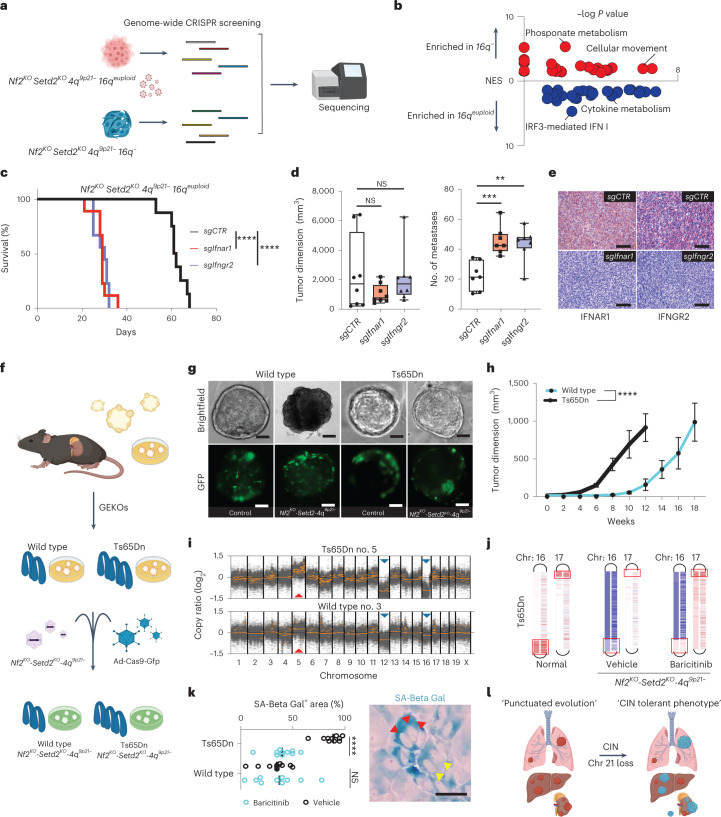
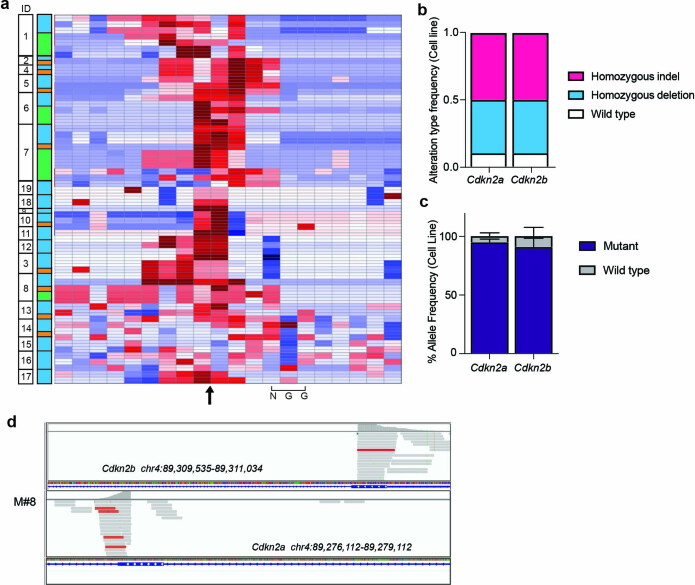
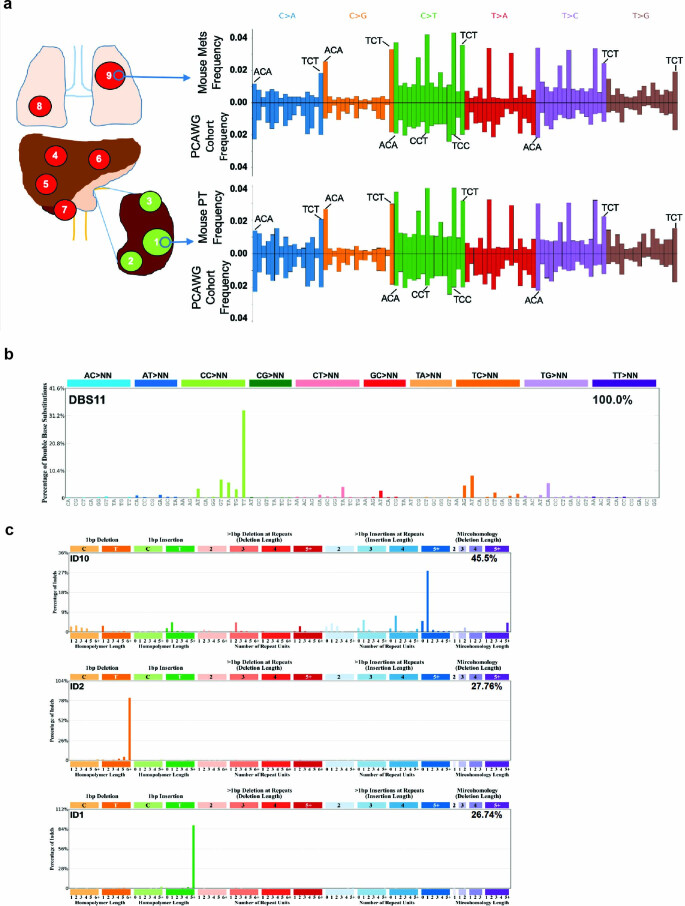
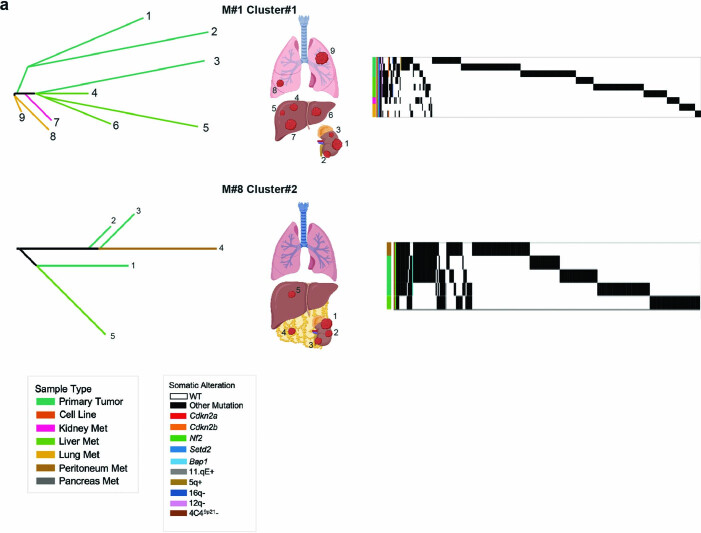
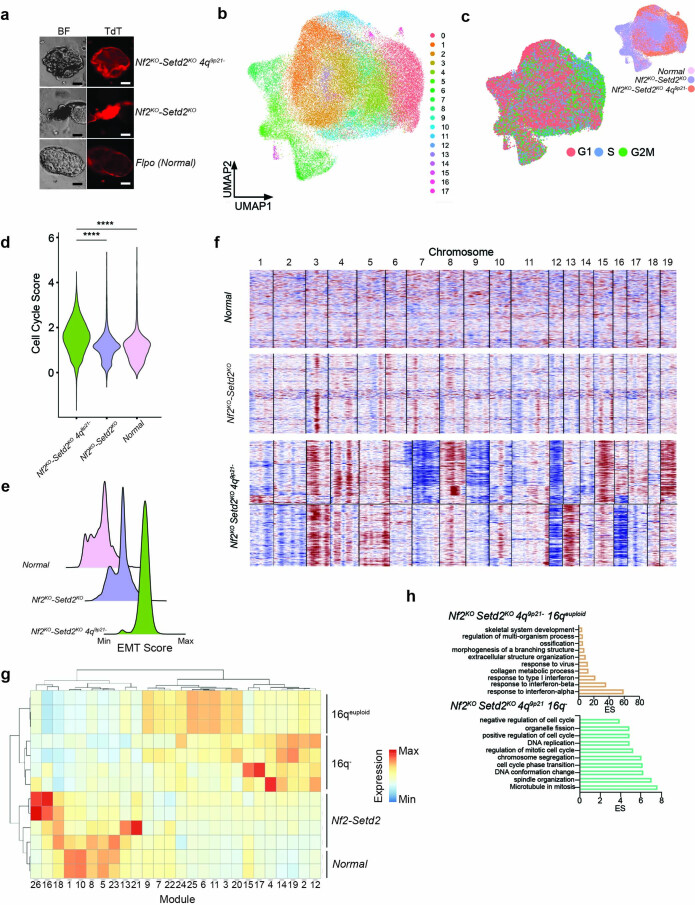
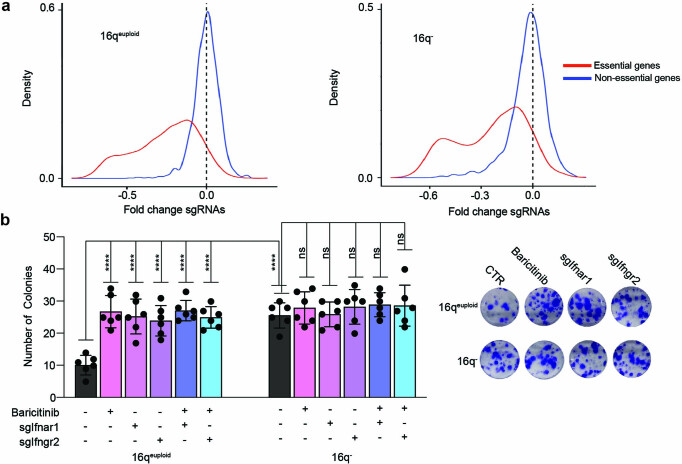
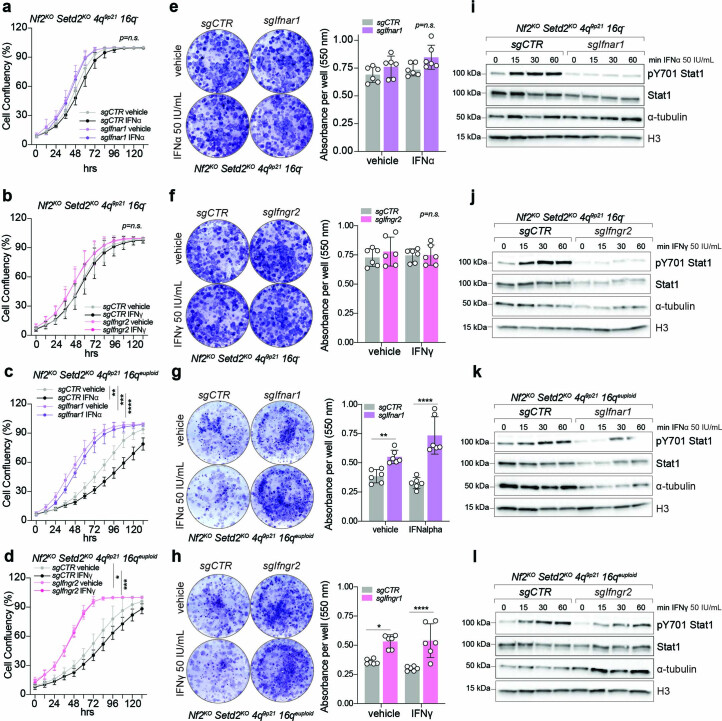
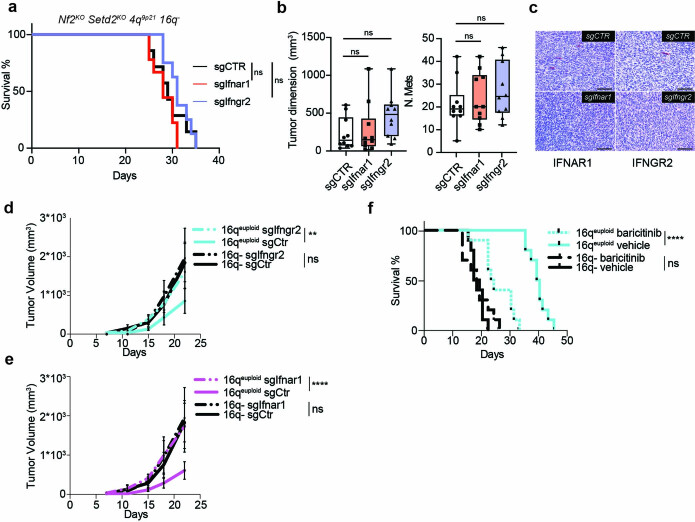
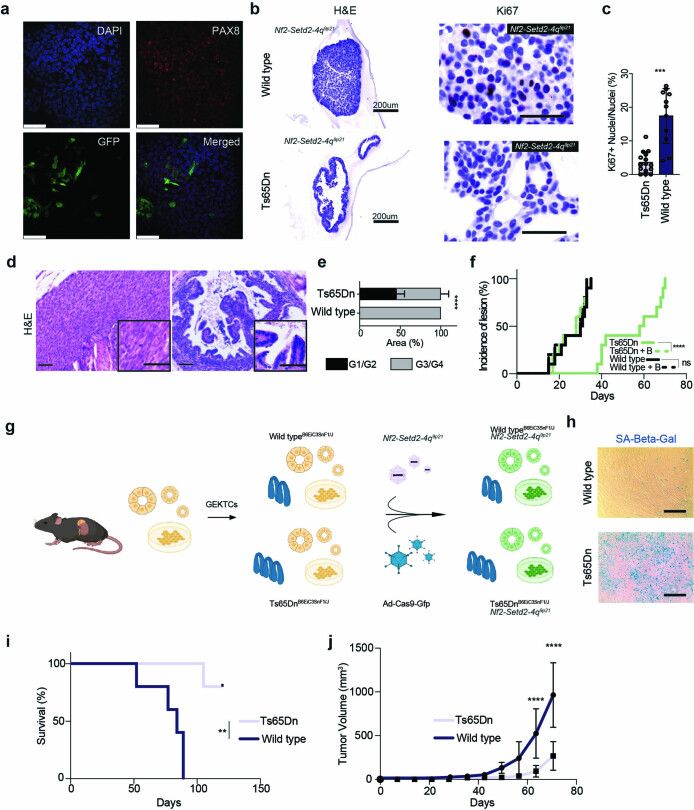
Molecular routes to metastatic dissemination are critical determinants of aggressive cancers. Through in vivo CRISPR-Cas9 genome editing, we generated somatic mosaic genetically engineered models that faithfully recapitulate metastatic renal tumors. Disruption of 9p21 locus is an evolutionary driver to systemic disease through the rapid acquisition of complex karyotypes in cancer cells. Cross-species analysis revealed that recurrent patterns of copy number variations, including 21q loss and dysregulation of the interferon pathway, are major drivers of metastatic potential. In vitro and in vivo genomic engineering, leveraging loss-of-function studies, along with a model of partial trisomy of chromosome 21q, demonstrated a dosage-dependent effect of the interferon receptor genes cluster as an adaptive mechanism to deleterious chromosomal instability in metastatic progression. This work provides critical knowledge on drivers of renal cell carcinoma progression and defines the primary role of interferon signaling in constraining the propagation of aneuploid clones in cancer evolution.


Conflict of interest statement

The authors declare no competing interests.

Figures

Fig. 1
Fig. 1. SM-GEMM of RCC.
a, Schematic showing the SM-GEMM design. Cancer-specific loss-of-function mutations are introduced via intraparenchymal delivery of AAV particles carrying specific sgRNA combinations. b, Representative E14 Pax8Cre/+ -R26LSL-TdT/+ embryos. The activation of the fluorescent reporter TdT can be readily appreciated in the developing hindbrain, notochord and kidney. n = 5 embryos. c, Schematic showing the AAV-based tracing system carrying a FLEx-GFP-reported sequence. IHC analysis on representative FFPE sections stained with a GFP-specific antibody. n = 5 mice. d, T7-endonuclease assay validating sgRNA for Trp53 (a), Nf2 (b), Bap1 (c), Setd2 (d), Cdkn2a (e), Cdkn2b (f) and negative controls (*). Images representative of n = 3 independent experiments. e, Pathological characterization of murine RCC obtained through somatic mosaic knockout of Nf2 and Setd2. (I) Gross specimens collected 8 months posttransduction; (II) axial T2 MRI scan displaying a small cortical lesion 8 months posttransduction; and (III) and (IV) hematoxylin and eosin (H&E)-stained sections from well-differentiated tumors collected at 6 and 8 months posttransduction, respectively. f, Kaplan–Meier analysis of cancer-specific survival of mice affected by Nf2KO-driven tumors. NB: Nf2KO-Bap1KO (n = 40 mice); NS: Nf2KO-Setd2KO (n = 20 mice); NBS: Nf2KO-Setd2KO-Trp53KO (n = 24 mice). P = 0.23, 0.054, 0.12. g, Upper panel, representative coronal T2 MRI scan at 3 months posttransduction in Nf2KO-Setd2KO-4q9p21 mice. Red arrows, primary tumor mass; red dashed lines, lung metastasis. Bottom panels, representative luminescence scans of mouse organs. 1, primary tumor; 2, lung metastasis; 3, liver metastasis. Images representative of n = 2 experiments. h, Characterization of Nf2KO-driven murine tumors upon genetic targeting of the murine locus syntenic to human 9p21.3 (4q9p21): representative macroscopic images (top panels), H&E, IHC and IF analysis (lower panels). Images representative of n = 2 experiments. i, Kaplan–Meier analysis of cancer-specific survival of mice affected by VhlKO-driven tumors with (n = 20 mice) or without (n = 20 mice) 4q9p21 loss, P = 1.18 × 10−8. j,k, Characterization of VhlKO-driven murine tumors upon genetic targeting of 4q9p21 locus: representative macroscopic images (j), H&E and IHC analysis of specific clear cell RCC markers (PAX8 and CD31) are shown (k). PT, primary tumor; LuM, lung metastasis; LiM, liver metastasis; PaM, pancreatic metastasis; MeM, mesenteric metastasis; DiM, diaphragm metastasis. Images representative of n = 2 experiments. NS, not significant; ****P < 0.0001 by log-rank (Mantel–Cox) test. Scale bar, 200 μm. BF, brightfield; E, embryonic day; FFPE, formalin-fixed paraffin-embedded; IF, immunofluorescence; MRI, magnetic resonance imaging; RLU, renilla luciferase. Source data
Fig. 2
Fig. 2. CIN is a feature of aggressive metastatic RCC.
a, Kaplan–Meier survival analysis of Nf2KO-driven tumors with (n = 99 mice) and without (n = 84 mice) 4q9p21-targeting sgRNAs. P < 1 × 10−15. b, Box and whiskers plot showing metastatic burden of 4q9p21 (n = 69 mice) and 4qwt (n = 15 mice) models; data are presented as mean ± s.d., P = 1.16 × 10−6. c,d, Cross-species comparison of site-specific metastasis (c) and disease burden (d); Mm, Mus musculus, n = 79 mice; Hs, Homo sapiens. e, Summary heatmap showing WES results (n = 81 samples derived from 19 mice) (Supplementary Table 1). f, Circos plot of the human to mouse synteny map for chromosome regions significantly altered in SM-GEMM. Statistics derived from n = 81 samples. g, Bar charts showing the percentage of private and truncal somatic events at primary (upper panel) and metastatic sites (bottom panel). h, Density plots displaying the VAF of observed somatic mutations. i, Histological high-power field magnification of normal anaphase (top left) and aberrant metaphases (top right) with IFs for cGAS (red) and DAPI (blue) (middle and bottom panels). Arrows indicate micronuclei. Scale bar, 30 μm. Images representative of n = 3 experiments. j,k, Box and whiskers plots showing percentages of tumor cells with aberrant mitosis (j), data are represented as median values, minimum and maximum (26.6, 20, 56.6 for Cluster no. 2 and 70, 88 and 95 for Cluster no. 1, respectively); and with micronuclei (k), data are represented as median values, minimum and maximum (3, 1, 6 for Cluster no. 2 and 8.5, 4 and 12 for Cluster no. 1, respectively). n = 8 tumors per condition (j), n = 12 tumors per condition (k); P = 1.80 × 10−7 (j) and 1.34 × 10−6 (k). l,m, Kaplan–Meier survival analysis (l) and metastatic lesions count (m) in Cluster no. 1 and Cluster no. 2 RCC GEM models transplants; P = 3.08 × 10−10 (l, n = 57 mice) and <1 × 10−15 (m, n = 109 mice). n, Violin plot showing aneuploidy score with 9p status and WGD (9p, n = 212 tumors; 9pwt, n = 710 tumors); P < 1 × 10−15 and P = 3.07 × 10−2. o, Bar chart showing the prevalence of WGD in 9pwt and 9p cases in TCGA and MSKCC datasets (n = 922 tumors); P < 1 × 10−15. *P < 0.05, ****P < 0.0001 by log-rank (Mantel–Cox) test (a,l), two-tailed t-test (b,j,k,m), two-tailed Mann–Whitney test (n) and two-sided Fisher’s exact test (o). Lu, lung; M, mouse; RDR, read depth ratio; Sp, splanchnic. Source data
Fig. 3
Fig. 3. Chromosome 16q loss is permissive for the emergence of aggressive tumors.
a, Schematic showing GEM model design for GEKOs generation (left) and experimental timeline (right) (dark purple, Nf2KO-Setd2KO-4q9p21−; purple, Nf2 KO-Setd2 KO; pink, empty vector). b, Bar graph displaying distribution of cells among 18 different clusters for the 3 different experimental groups. c, Three-dimensional distribution of the 87,718 GEKO-derived cells; the color scale bar is based on pseudotime values. d, Distribution plots of individual samples according to pseudotime values (left panel) and three-dimensional distribution along the pseudotime of the three different experimental groups (right panels). e, Three-dimensional distribution across the pseudotime of cells with euploid 16q (Nf2KO-Setd2KO-4q9p21−16qeuploid, pink) and with 16q (Nf2KO-Setd2KO-4q9p21−16q, green). n = 87,718 cells. f, Violin plot showing pseudotime distributions in the four different genomic groups; P < 1 × 10−15. g, Kaplan–Meier survival analysis of CB17SC-F SCID mice inoculated orthotopically in the kidney with SM-GEMM-derived cell lines, 16q (n = 10 mice) or 16qeuploid (n = 10 mice); P = 3.23 × 10−6. ****P < 0.0001 by two-tailed Mann–Whitney test (f) and by log-rank (Mantel–Cox) test (g). Source data
Fig. 4
Fig. 4. Interferon signaling suppression drives expansion of aneuploid RCC clones.
a, Circos plots of the human to mouse synteny map for chromosome regions significantly lost in SM-GEMM tumor-bearing mice, generated by the SynCircos function of Synteny Portal. Magnification of the human chromosome 21 region shows the genomic location and coordinates of the IFNR cluster. b, Violin plot displaying interferon (Ifn) score calculated for four different groups clustered by genomic data (P < 1 × 10−15, n = 87,718 cells). c, Violin plots displaying expression values of Isg15 (top) and Irf7 (bottom) calculated for four different groups clustered by genomic data (P < 1 × 10−15, n = 87,718 cells). d, Three-dimensional distribution of the Ifn score values for all the cells. e, Three-dimensional representation of two subpopulations with high values of Ifn score (left panel) and low values of Ifn score (right panel), displaying the distribution in the four different genomic groups and pseudotime values. n = 87,718 cells. f, Expression values of two genes involved in chromosome stability and mitotic checkpoint in the Ifn low and Ifn high groups; P  < 1 × 10−15. n = 37,624 cells. g, Violin plot displaying the CNV score in the ‘Ifn high’ and ‘Ifn low’ groups; P < 1 × 10−15. n = 37,624 cells. h, Violin plot displaying fCNA values across different tumors with 9p or 9p and 21q, with or without WGD, in two different cohorts: TCGA-KIPAN (left panel), P = 2.76 × 10−7, 1.67 × 10−2 and 1.46 × 10−5; MSKCC (right panel), P = 1.76 × 10−4 and 5.77 × 10−5. n = 922 tumors. i, Volcano plot showing top upregulated and downregulated pathways, comparing 9p and 21q tumors versus 9p tumors in the TCGA-KIPAN transcriptomic dataset. n = 788 tumors. *P < 0.05, **P < 0.01, ***P < 0.001, ****P < 0.0001 by two-tailed Mann–Whitney test (b,fh). Rej., rejection; resp., response; TGCA-KIPAN, TCGA pan-kidney. Source data
Fig. 5
Fig. 5. CIN is associated with interferon signaling suppression in RCC.
a, Dot plot showing copy number log values of the IFNAR2 gene across human cell lines derived from nonhematological malignancies as calculated from the Cancer Cell Line Encyclopedia (CCLE). Cell lines were divided based on their aneuploidy score; P = 0.0099. b, Dot plot showing copy number log values of the IL10RB gene, across the same cell lines as a. P = 0.0099, n = 789 cell lines. c, Dot plot showing copy number log values of the IFNAR1 gene, across the same cell lines as a. P = 0.00992, n = 789 cell lines. d, Dot plot showing copy number log values of the IFNGR2 gene, across the same cell lines as a. P = 0.015, n = 789 cell lines. e, Scatter dot plot copy number log values of two IFNR genes located on the specific deleted chromosome 21 region; P < 1 × 10−15. n = 789 cell lines. f, Heatmap displaying the clinical, histological and genomic annotation of specific features across MSKCC RCC cohort (upper left panel), TRACERx RCC cohort (bottom left panel) and TCGA-KIPAN cohort (upper right panel). g, Bar plot showing co-occurrence of 21q loss and 9p loss in the three different clinical cohorts; from left to right, P = 1.04 × 10−4 and 0.0016. From left to right, n = 788, 101 and 134 tumors. *P < 0.05; **P < 0.01; ***P < 0.001; ****P < 0.0001 by two-sided Mann–Whitney test (ad), Pearson correlation (e) and two-sided Fisher exact chi-squared test (g). N/A, not applicable; WT, wild type. Source data
Fig. 6
Fig. 6. IFNR drives a senescence response that limits RCC progression.
a, In vitro CRISPR screening schematic. b, Volcano plot showing enriched pathways in 16q and 16qeuploid cell lines using as input the top ranked 2,000 TSGs. n = 60 differentially expressed pathways. c, Survival curve of 16qeuploid tumor-bearing mice with knockout of either Ifnar1 or Ifngr2; P = 3.44 × 10−5 and 4.20 × 10−5. n = 26 mice. d,e, Tumor dimensions and number of metastases; data are represented as median values, minimum and maximum (sgCTR: 1,702.5, 198, 6,394; sgIfnar1: 750, 405, 2,176; sgIfngr2: 1,702.5, 607, 6,250 for tumor dimensions; n = 9 tumors per group; and sgCTR: 21, 10, 34; sgIfnar1: 42, 35, 64; sgIfngr2: 46, 20, 57 for number of metastases; n = 8 tumors per group) (d); and IHC of IFNAR1 and IFNGR2 in primary tumors (e). P  = 6.33 × 10−4, 2.72 × 10−3, 0.17, 0.63. Scale bar, 100 μm. f, Schematic of the experimental design and GEKO generation for the Ts65Dn model. g, Microscopic images of wild-type (top left) and Ts65Dn (top right) GEKOs coinfected with Ad-Cas9-GFP with or without the AAV-Nf2KO-Setd2KO- 4q9p21−. Scale bar, 30 μm. Images representative of n = 2 experiments. h, Growth curve of transformed wild-type and Ts65Dn GEKOs transplanted subcutaneously; data are presented as mean ± s.d. (wild type, n = 5 tumors; Ts65Dn, n = 5 tumors), P = 3.28 × 10−9. i, Scatter plots of GEKO wild-type- and Ts65Dn-derived tumors; red arrows, amplifications; blue arrows, deletions. j, Chromosome 16 and 17 diagrams showing regions of amplification and deletion; from left to right: normal tissue from Ts65Dn versus normal tissue from wild-type mouse; CRISPR-induced tumor from Ts65Dn treated with vehicle versus normal tissue from Ts65Dn; CRISPR-induced tumor from Ts65Dn treated with baricitinib versus normal tissue from Ts65Dn. Boxes represent the genomic region affected with partial trisomy in the Ts65Dn model. k, Quantification (left) and representative picture (right) of GEKTCs derived from wild-type and Ts65dn mice, treated with vehicle or baricitinib. n = 10 fields per condition, P = 2.10 × 10−8. Arrows indicate the presence of multiple nuclei in senescent cells. Scale bar, 30 μm. l, Schematic proposing loss of chromosome 21 as a cell-autonomous mechanism to CIN tolerance and evolution of advanced RCC. **P < 0.01, ***P < 0.001, ****P < 0.0001 by log-rank (Mantel–Cox) test, (c) two-way ANOVA (h) and two-tailed Student’s t-test (d,k). SA-Beta-Gal, beta-galactosidase. Source data
Extended Data Fig. 1
Extended Data Fig. 1. Clinical features of RCC characterized by loss of 9p.
a) Odds plot showing enrichment fatal events in NF2KO/9p cases and stage III/IV among MSKCC cohort patients, data are represented as hazard ratios with upper and lower limits (N = 134 patients), p values = 2.70*10-4 and 1.68*10-7. b-c) Bar charts showing the prevalence of metastasic (b), p value = 9.21*10-3, and sarcomatoid (c), p value = 1.80*10-4 features in NF2wt/9pwt, NF2KO/9pwt, NF2wt/9p, and NF2KO/9p- cases in the MSKCC cohort (N = 52, 10, 51, and 21 patients, respectively). d) Representative H&E stained images from two MSKCC cohort cases. Upper panel: NF2KO/9pwt; bottom panel: NF2KO/9p-. Images representative of the genomic background. In the latter, sarcomatoid features are readily observed. e) Kaplan–Meier survival analysis of human RCCs with and without sarcomatoid features in MSKCC (N = 16 vs N = 97 patients) (left panel), TCGA (N = 45 vs N = 743 patients) (middle panel) and TRACERx (N = 10 vs N = 91 patients) (right panel) cohorts, p values = 2.37*10-4, p value < 1*10-15 and p value = 0.016. f) Kaplan–Meier survival analysis of human RCCs with and without 9p loss features in MSKCC (N = 72 vs N = 62 patients) (left panel), TCGA (N = 140 vs N = 658 patients) (middle panel) and TRACERx (N = 57 vs N = 38 patients) (right panel) cohort, p values = 0.023, 1.21*10-8, 0.045. g-h) Bar chart showing the prevalence of sarcomatoid features in 9pwt and 9p- cases in TCGA pan-RCC dataset (N = 648 vs N = 140 tumors) (g), p value = 0.025, and TRACERx RCC dataset (N = 45 vs N = 61 tumors) (h). i-j) Bar chart showing the prevalence of stage I/II and stage III/IV features in 9pwt and 9p- cases in TCGA pan-RCC dataset (N = 628 vs N = 136 patients) (i) and TRACERx RCC dataset (N = 45 vs N = 61 patients) (j), p values = 1.56*10-8 and 9.29*10-5. k-l) Bar chart showing the prevalence of metastasis features in 9pwt and 9p- cases in TCGA pan-RCC dataset (N = 628 vs N = 136 patients) (k) and TRACERx RCC dataset (N = 45 vs N = 61 patients) (l), p values = 2.86*10-4 and 0.008. ns.: not significant, * P < 0.05, ** P < 0.01, *** P < 0.001, **** P < 0.0001 by two-sided Fisher’s exact test (b, c, g-l), log-rank (Mantel–Cox) test (a,e, f). Scale bar: 100 μm.
Extended Data Fig. 2
Extended Data Fig. 2. Efficiency of in vivo CRISPR/Cas9 genome editing in SM-GEMM of RCC.
a) Heatmap showing the average Z-transformed log odds ratio across all edited genes for the likelihood of specific base alterations in any reads spanning an expected cut site. Data in figure were generated from WES analysis of primary tumor samples and matched metastatic sites (N = 81 samples across 19 mice). b-c) Bar plot displaying type (b) and allelic frequency (c) of genomic alterations in Cdkn2a and Cdkn2b loci of tumor-derived cell lines from WES data analysis, data are represented as frequencies (b) and mean values +/- SD (c) (N = 4 and 5 cell lines respectively). d) Representative IGV snapshot showing homozygous deletion of the envisaged targeted ~ 40 kb region spanning Cdkn2a and Cdkn2b genes. Source data
Extended Data Fig. 3
Extended Data Fig. 3. Mutational signatures of metastatic disease.
a) Trinucleotide context-specific somatic SNV frequencies as detected by WGS in 2 metastatic samples (upper panel), 6 primary tumors and 2 cell line samples (lower panel) as compared to corresponding trinucleotide context-specific somatic SNV frequencies in pan-kidney tumor cohort (n = 148 tumors) analyzed by WGS. b-c) Comprehensive SM-GEMM cohort frequency plot showing percentage of double base substitutions (b) and indels (c) as calculated from WES data analysis.
Extended Data Fig. 4
Extended Data Fig. 4. WGD and polyploidization are critical events in metastatic RCC.
a) Summary of segment-level amplification or deletion frequency across murine primary tumors or metastatic lesions as determined by GISTIC2. b) Representative scatter plots of exon-level log2(Read-Depth Ratios) as calculated by CNVkit from primary tumor derived cell lines from tumor within Cluster #1 (left panel) and Cluster #2 (right panel), where different patterns of chromosomal alterations can be appreciated. c) Representative sections of TdT stained tumor tissues. Images representative of N = 2 experiments. d) Cellularity estimation of primary and metastatic samples as assessed through TdT positive cell quantification, data are presented as mean values +/- SD (N = 4 fields per tumor). e) Most probable ploidy by log posterior probability at given sample’s cellularity as predicted by Sequenza from WGS data (representative mouse #7 and #8. f) Chromosome counts in RCC SM-GEMM–derived short-term cultures. Malignant cells are characterized by prominent polyploidy, data are represented as median values, minimum, maximum (M#7: 72, 42, 85; M#1: 60, 48, 84; M#8: 58, 55, 94; M#3: 52, 50, 78; M#5: 54, 40, 80; M#4: 58, 44, 64) with boundaries at the 25th and 75th percentile (N = 5/line tested). g) Costaining of chromosomes (DAPI) and centromeres in representative nuclei of metaphase short-term cultures, established from Nf2KO-Setd2KO-Trp53KO-4q9p21 tumor-bearing mice. Images representative of N = 2 experiments. h) Comparison of primary tumor sample and matched normal B-allele frequencies (BAF) of heterozygous SNPs derived from WGS in the matched normal tissue sample (0.2 ≤ normal sample SNP BAF ≤ 0.8). The analysis was performed on chromosomes undergoing gains (5q, 11q) or losses (12q, 16q). A copy-neutral chromosome was used as control (6q). Correlation of SNP BAFs between tumor and matched normal samples. The BAFs of heterozygous SNPs suggest that WGD precedes somatic CNVs. Error bars represent the standard deviation of technical replicates. Scale bar: 100 μm. Source data
Extended Data Fig. 5
Extended Data Fig. 5. Genomic evolution of metastatic disease.
a) Phylogenetic sample trees of Cluster#1 (top left) and Cluster#2 (bottom left) RCC tumor-bearing mice; different pattern of evolution can be clearly appreciated. Oncoprints of Cluster#1 (top right) and Cluster#2 (bottom right) RCC tumor-bearing mice displaying time of driver engineered and spontaneous somatic events in primary and secondary lesions. Source data
Extended Data Fig. 6
Extended Data Fig. 6. scRNA sequencing characterization of GEKOs.
a) Microscopic representative pictures of GEKOs 10 weeks after AAV transduction for the three different experimental groups. Images representative of N = 3 experiments (left: brightfield; right: tdTomato). b) Bi-dimensional cluster distribution of the 87718 GEKOs cells after filtering and quality control distributed on a UMAP plot. c-d) Cell cycle status and group distribution of single GEKOs cells as calculated by Seurat (c) and violin plot of Cell cycle score values (d), p < 1*10-15, for the 3 different experimental groups. N = 87718 cells. e) Ridge plots of representing the distribution of single cells along a calculated EMT signature (EMT Score). f) Copy number heatmap of representative samples of the Normal, Nf2KO-Setd2KO and Nf2KO-Setd2KO-4q9p21 experimental groups generated by InferCNV; CIN can be appreciated in the Nf2KO-Setd2KO-4q9p21 with recurrent CNA patterns. g) Heatmap showing upregulated and downregulated modules as calculated by Moncole3 in the 4 distinct genomic groups. A clear difference among modules can be appreciated between 16qeuploid and 16q-. h) Over representation pathway analysis of top markers calculated by Seurat for the 16qeuploid (top panel) and 16q- (bottom panel) cell lines. **** P < 0.0001 by Mann-Whitney test (d). Source data
Extended Data Fig. 7
Extended Data Fig. 7. IFNRs are tumor suppressive in a cell autonomous manner.
a) Genome-Wide CRISPR Screen quality control via fold change separation curves generated using a previously curated list of known essential and non-essential genes. Comparison of the foldchange of guide level abundance at 20 doublings to the reference timepoint reveals significant drop-out in the essential genes and minimal drop out in the non-essential population, indicating no change from the reference population. b) Colony forming unity assay showing number of colonies after Ifnra1 or Ifngr2 knockouts with or without Baricitinib treatment compared to parental untreated cells (left panel) and representative images of the experiment (right panel), data are presented as mean values +/- SD (N = 6 tumors per each condition), p values = 4.73*10-5, 0.0012, 5.17*10-4, 1.25*10-5, 1.47*10-4. **** P < 0.0001 by two-way Anova with Tukey’s multiple comparison (b). Source data
Extended Data Fig. 8
Extended Data Fig. 8. IFNRs loss protects RCC from deleterious effects of IFN type I and II treatment on cell proliferation and survival.
a-d) Growth curves of 16q loss and 16q euploid RCC lines with or without knockout of Ifnar1 or Ifngr2 treated with mouse IFN-gamma, IFN-alpha or untreated. A beneficial effect of interferon receptor loss can be appreciated when 16q euploid cells are treated with IFN-alpha or IFN-gamma, data are presented as mean values +/- SD (N = 8 measurements of replicates per each time point), p values = 0.012, 0.0002 and 4.29*10-9 (c), p values 0.035 and 0.007 (d). e-h) Representative colony pictures (left) and relative quantification bar graphs (right) of 16q loss and 16q euploid RCC lines with or without knockout of Ifnar1 or Ifngr2 treated with mouse IFN-gamma, IFN-alpha or untreated. Loss of either Ifngr2 or Ifnar1 resulted in a beneficial long-term proliferative advantage only in 16q euploid RCC lines, data are presented as mean values +/- SD (N = 6 measurements of replicates per each condition), p values = 0.026 and 4.80*10-9 (g), p values = 0.018 and 3.28*10-8 (h). i-l) Western blots showing evidence of reduced STAT1 phosphorilation under interferon administration in cell lines knocked-out for either Ifngr2 or Ifnar1. Images representative of N = 3 independent experiments. * P < 0.05; ** P < 0.01; ***P < 0.001; **** P < 0.0001 by two-way ANOVA with multiple t-test (a-h). Source data
Extended Data Fig. 9
Extended Data Fig. 9. Chromosome 21q loss and IFNR loss confer a pro-tumorigenic and pro-metastatic phenotype in RCC.
a) Survival curves of 16q- tumor bearing mice with either knockout of Ifnar1, Ifngr2 or none (N = 10 mice per each condition). p value = 0.15 b-c) Clinicopathological assessment of tumor dimension and number of metastasis, data are represented as median values, minimum, maximum (sgCTR: 135.75, 32, 600; sgIfnar1: 144, 13.5, 1080; sgIfngr2: 477.5, 87.5, 1080 for Tumor dimension and sgCTR: 19, 5, 42; sgIfnar1: 20, 10, 42; sgIfngr2: 24.5, 12, 46 for number of metastasis) with boundaries at the 25th and 75th percentile (b) and immunohistochemical staining of IFNAR1 and IFNGR2 in primary tumors at endpoint (c) for 16q- tumor bearing mice. (N = 10 tumors per each condition) d-e) Growth curves of 16qeuploid and 16q- cell lines upon knock-out of Ifngr2 (N = 5 tumors per condition, d), p value = 0.065, and Ifnar1 (N = 5 tumors per condition, e). p = 5.84*10-6 after subcutaneous transplantation in NOD-SCID mice, data are presented as mean values +/- SD. f) Survival curves of 16qeuploid and 16q- tumor bearing mice treated (N = 10 mice per each condition) or not (N = 10 mice) with Baricitinib, p = 5.08*10-6. ** P < 0.01; **** P < 0.0001 by two-way Anova (b,d,e) and log-rank (Mantel–Cox) test (a,f). Source data
Extended Data Fig. 10
Extended Data Fig. 10. An extra copy of the IFNR cluster is sufficient to restrains malignant transformation in RCC.
a) Confocal images of a GEKO infected with Ad-Cas9-GFP. The positive staining with the renal marker PAX8 confirmed a tubular origin of this organoids; GFP staining confirmed the successful transduction. Scale bar: 100μm b-c) Representative histopathological images of “Wild type” and “Ts65Dn” GEKOs cotransduced with sgRNAs-carrying AAV and Ad-Cas9-GFP stained for the proliferation marker Ki67 (b) and relative quantification (c), data are presented as mean values +/- SD, p value = 3.17*10-6. Scale bar: 100μm (N = 15 for “Ts65Dn and N = 11 for “Wild type”) Images representative of N = 2 experiments. d-e) Representative H&E images showing sarcomatoid (left panel) and tubule-papillary like (right panel) morphology for “Wild type” and “Ts65Dn” GEKO-derived tumors respectively (e); quantification of “Ts65Dn” and “Wild type” GEKO-derived tumors with histological low grade (G1/G2) and high grade (G3/G4), data are presented as mean values +/- SD (N = 25 fields per each condition, p < 1*10-15) (e). Scale bar: 100μm f) Incidence curves of tumor bearing mice transplanted with “Ts65Dn” or “Wild type” GEKOs and treated with Vehicle or Baricitinib, p value = 4.47*10-6. g) Schematic showing the generation of GEKTCs. h) Representative images of “Wild type” and “Ts65Dn” GEKTCs stained for SA-Beta-Gal. Images representative of N = 3 experiments. I-j) Survival curves of “Ts65Dn” (N = 5 mice) and “Wild type” (N = 5 mice) GEKTC cell lines transplanted in immunocompromised mice and respective tumor growth curve, data are presented as mean values +/- SD, p values = 0.0026, 1.49*10-5 and 2.74*10-11 (j). Scale bar: 100μm. ** P < 0.01, *** P < 0.001, **** P < 0.0001 by student-T test (c) Chi test (e) log-rank (Mentel-Cox) test (f-i) and two-way ANOVA (j). Source data

Comment in

References

    1. Nguyen B, et al. Genomic characterization of metastatic patterns from prospective clinical sequencing of 25,000 patients. Cell. 2022;185:563–575.e511. - PMC - PubMed
    1. Sanchez-Vega F, et al. Oncogenic signaling pathways in The Cancer Genome Atlas. Cell. 2018;173:321–337.e310. - PMC - PubMed
    1. Turajlic S, et al. Tracking cancer evolution reveals constrained routes to metastases: TRACERx Renal. Cell. 2018;173:581–594.e512. - PMC - PubMed
    1. Dabestani S, et al. Renal cell carcinoma recurrences and metastases in primary non-metastatic patients: a population-based study. World J. Urol. 2016;34:1081–1086. - PubMed
    1. Kotecha RR, Motzer RJ, Voss MH. Towards individualized therapy for metastatic renal cell carcinoma. Nat. Rev. Clin. Oncol. 2019;16:621–633. - PubMed

Publication types

MeSH terms