. 2023 Aug;20(8):1213-1221.
doi: 10.1038/s41592-023-01914-y. Epub 2023 Jun 26.

Multiscale analysis of pangenomes enables improved representation of genomic diversity for repetitive and clinically relevant genes

Affiliations

Multiscale analysis of pangenomes enables improved representation of genomic diversity for repetitive and clinically relevant genes

Chen-Shan Chin et al. Nat Methods. 2023 Aug.

Abstract

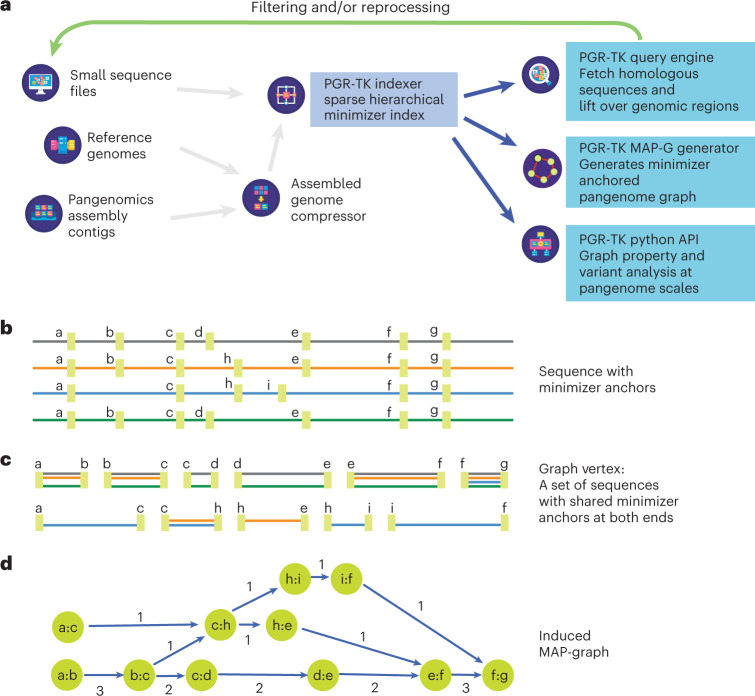
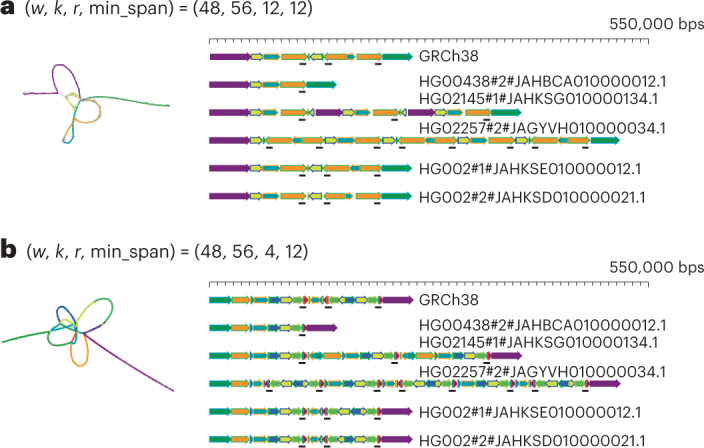
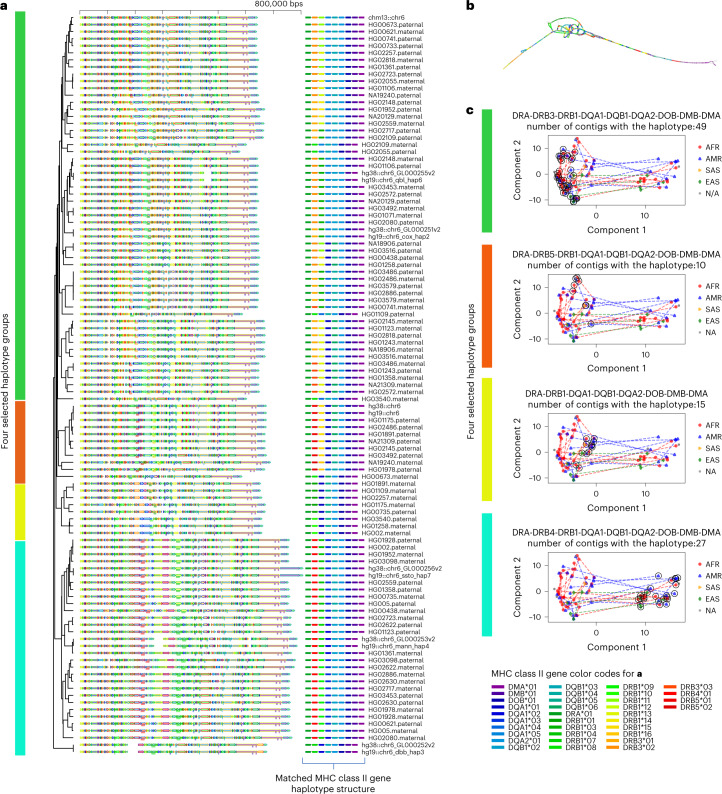
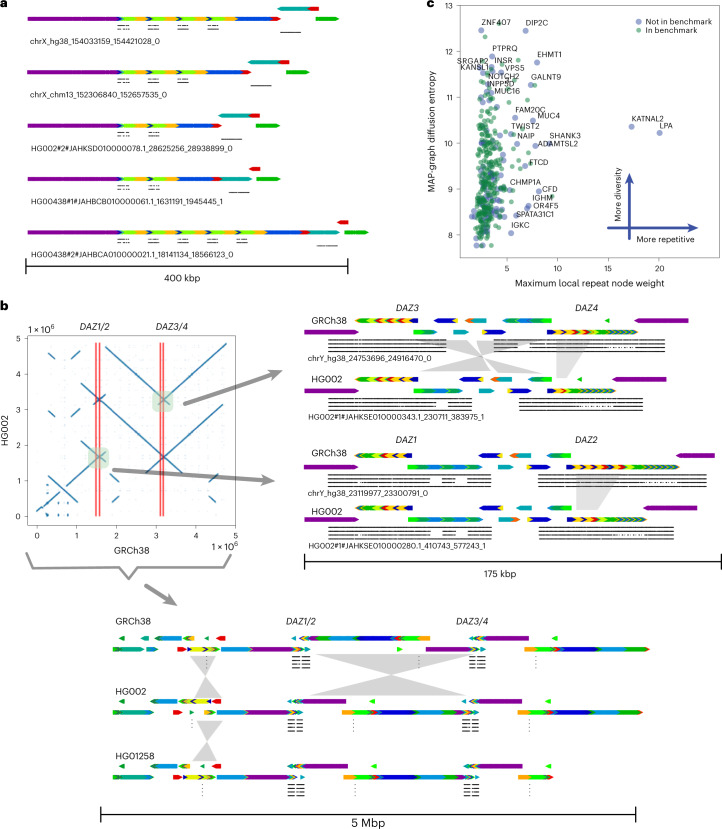
Advancements in sequencing technologies and assembly methods enable the regular production of high-quality genome assemblies characterizing complex regions. However, challenges remain in efficiently interpreting variation at various scales, from smaller tandem repeats to megabase rearrangements, across many human genomes. We present a PanGenome Research Tool Kit (PGR-TK) enabling analyses of complex pangenome structural and haplotype variation at multiple scales. We apply the graph decomposition methods in PGR-TK to the class II major histocompatibility complex demonstrating the importance of the human pangenome for analyzing complicated regions. Moreover, we investigate the Y-chromosome genes, DAZ1/DAZ2/DAZ3/DAZ4, of which structural variants have been linked to male infertility, and X-chromosome genes OPN1LW and OPN1MW linked to eye disorders. We further showcase PGR-TK across 395 complex repetitive medically important genes. This highlights the power of PGR-TK to resolve complex variation in regions of the genome that were previously too complex to analyze.


Conflict of interest statement

C.-S.C. is an employee and shareholder of GeneDX. F.J.S. obtains research support from Illumina, PacBio and Oxford Nanopore. The remaining authors declare no competing interests.

Figures

Fig. 1
Fig. 1. The architecture of PGR-TK and minimizer anchored graph construction.
a, Overall architecture and design scope of the PGR-TK library. b, Each sequence in the database is scanned, and the location of the minimizers are recorded to construct the SHIMMER database and MAP-graph. c, Each vertex in the MAP-graph represents a collection of sequence fragments sharing the two ending SHIMMERs in the database. d, The MAP-graph is constructed by merging all paths from all sequences into a graph.
Fig. 2
Fig. 2. AMY1A MAP-graph in two different scales.
a, The left panel shows a sparse MAP-graph representation of the AMY region with (w, k, r, min_span) = (48, 56, 12, 12). 503 vertices and 699 edges represent the 200–550 kb AMY region. The graph vertices are colored by the principal bundles that correspond to the principal bundle decomposition of selected genomes on the right panel (gray vertices are those that are not in the principal bundles). b, The left panel shows a denser MAP-graph with r = 4. The graph has 3,471 vertices and 2,684 edges, which is about 5 times as much as the MAP-graph in a. The principal bundle decomposition reveals a more detailed repeat structure than in a.
Fig. 3
Fig. 3. Principal bundle decomposition reveals distinct haplotype groups.
a, The principal bundle decomposition and annotated HLA class II genes in each of the haplotype sequences. The auxiliary tracks below each sequence on the left panel show the locations of the genes. The colors of the auxiliary tracks match the gene list of genes identified for each haplotype on the right. b, The MAP-graph generated by PGR-TK. c, PCA plots of the MHC class II sequences. Each panel highlights the different gene haplotype combinations. The vertical color bars indicate the matched haplotype groups in b and c. The circled symbols indicate the haplotypes belong to the corresponding group. The dotted lines represent the connection between the two haplotypes of individuals included in the analysis set who possess both haplotypes. The population groups, African Ancestry(AFR), American Ancestry (AMR), South Asia Ancestry(SAS), East Asia Ancestry(EAS) and not applicable (NA), are indicated with different markers of different colors.
Fig. 4
Fig. 4. Principal bundle decomposition for genes in the repetitive regions of chromosome X and Y.
a, MAP-graph principal bundle decomposition shows the repeat number changes of the OPN1LW, OPN1MW1/2/3 to FLNA loci. Auxiliary tracks are as follows: top OPN1LW, middle OPN1MW1/2/3 and bottom FLNA. b, The upper left image displays a dot plot comparing the HG002 assembly to GRCh38 over a 5 Mb region containing the DAZ1/2/3/4 loci, highlighting an inversion between DAZ1/2 and DAZ3/4. The image on the right provides a detailed view of the rearrangements at the gene scale level, with four tracks indicating the local matches to DAZ1/2/3/4 from top to bottom. Comparison to GRCh38’s DAZ2 reveals that the HG002 assembly is missing a segment (roughly 10 kb) of the darker green. The intergenic region between DAZ3 and DAZ4 also displays a rearrangement that can be described as an incomplete inversion or separate insertions and deletions. The bottom image shows a rearrangement at the whole locus, including all DAZ1/2/3/4 over a 5 Mb region. The principal bundle decomposition reveals the different inverted structure of the HG002 T2T assembly and the HG1258 assembly compared to GRCh38. c, MAP-graph diffusion entropy versus repetitiveness survey for the 385 GIAB challenge CMRGs.

References

    1. Lander ES, et al. Initial sequencing and analysis of the human genome. Nature. 2001;409:860–921. doi: 10.1038/35057062. - DOI - PubMed
    1. Venter JC, et al. The sequence of the human genome. Science. 2001;291:1304–1351. doi: 10.1126/science.1058040. - DOI - PubMed
    1. Nurk S, et al. The complete sequence of a human genome. Science. 2022;376:44–53. doi: 10.1126/science.abj6987. - DOI - PMC - PubMed
    1. Siva N. 1000 Genomes project. Nat. Biotechnol. 2008;26:256. doi: 10.1038/nbt0308-256b. - DOI - PubMed
    1. Canela-Xandri O, Rawlik K, Tenesa A. An atlas of genetic associations in UK Biobank. Nat. Genet. 2018;50:1593–1599. doi: 10.1038/s41588-018-0248-z. - DOI - PMC - PubMed

Publication types