. 2023 Jul;29(7):1671-1680.
doi: 10.1038/s41591-023-02408-2. Epub 2023 Jun 26.

Phenotypic effects of genetic variants associated with autism

Affiliations

Phenotypic effects of genetic variants associated with autism

Thomas Rolland et al. Nat Med. 2023 Jul.

Abstract

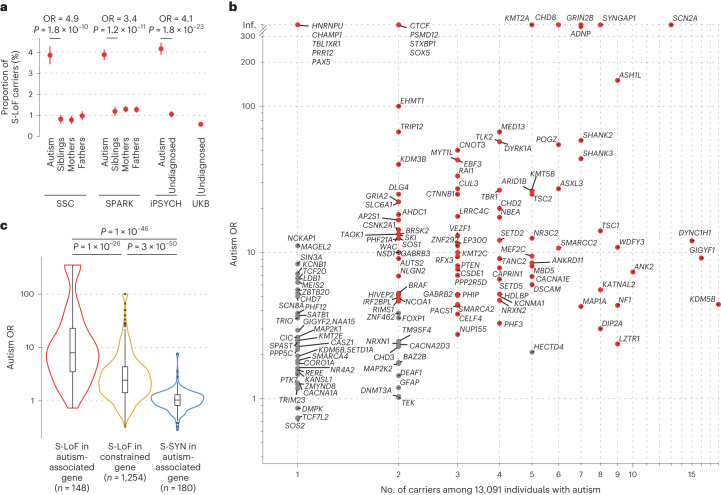
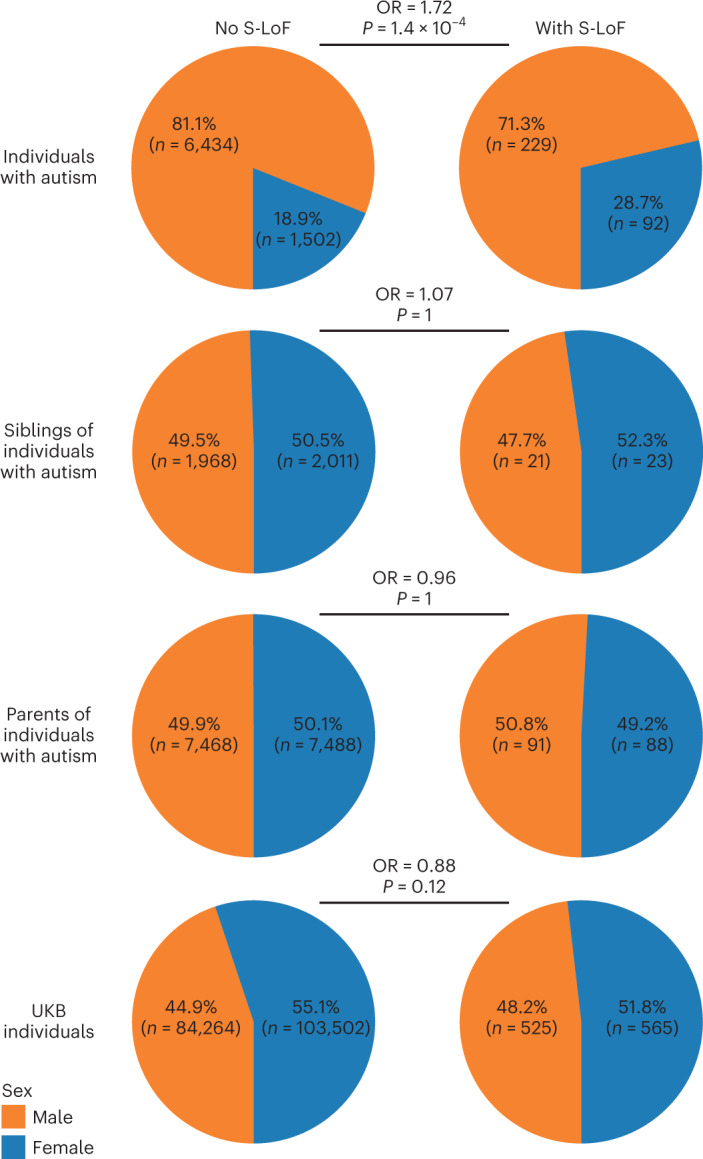
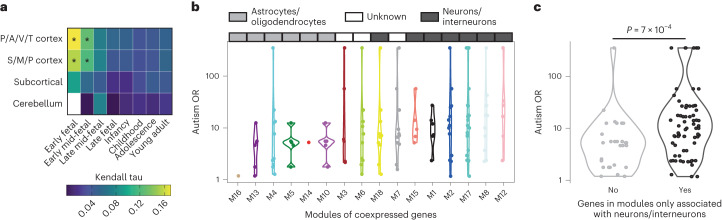
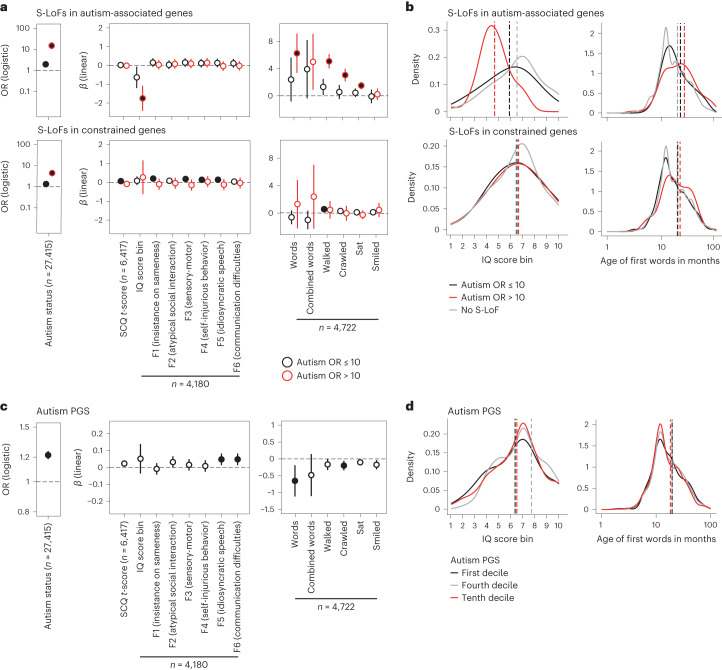
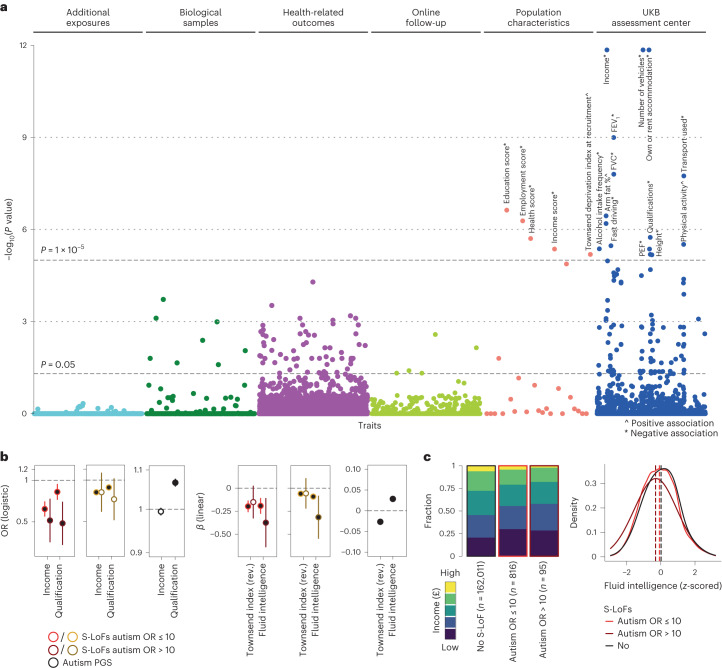
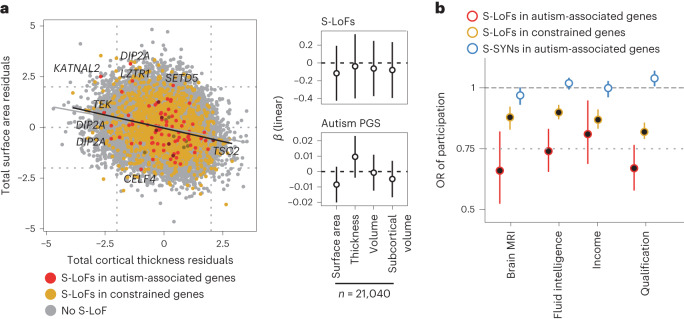
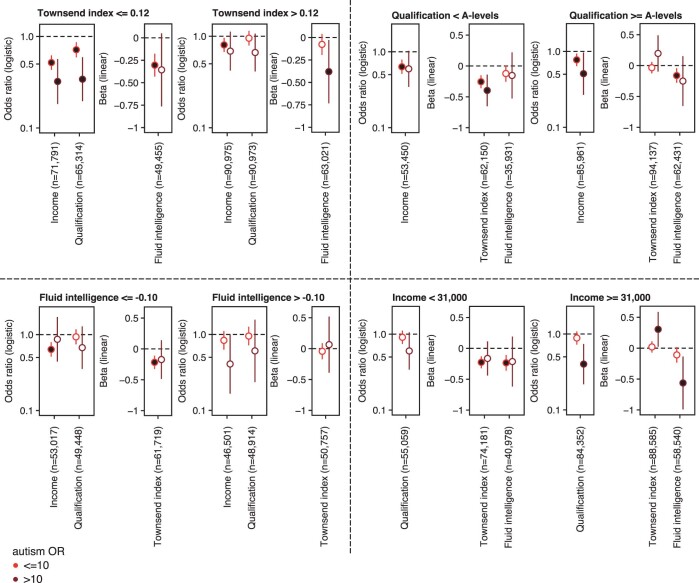
While over 100 genes have been associated with autism, little is known about the prevalence of variants affecting them in individuals without a diagnosis of autism. Nor do we fully appreciate the phenotypic diversity beyond the formal autism diagnosis. Based on data from more than 13,000 individuals with autism and 210,000 undiagnosed individuals, we estimated the odds ratios for autism associated to rare loss-of-function (LoF) variants in 185 genes associated with autism, alongside 2,492 genes displaying intolerance to LoF variants. In contrast to autism-centric approaches, we investigated the correlates of these variants in individuals without a diagnosis of autism. We show that these variants are associated with a small but significant decrease in fluid intelligence, qualification level and income and an increase in metrics related to material deprivation. These effects were larger for autism-associated genes than in other LoF-intolerant genes. Using brain imaging data from 21,040 individuals from the UK Biobank, we could not detect significant differences in the overall brain anatomy between LoF carriers and non-carriers. Our results highlight the importance of studying the effect of the genetic variants beyond categorical diagnosis and the need for more research to understand the association between these variants and sociodemographic factors, to best support individuals carrying these variants.


Conflict of interest statement

The authors declare no competing interests.

Figures

Fig. 1
Fig. 1. Gene-level autism odds ratio for rare variants in autism-associated and constrained genes.
a, Proportion of individuals carrying high-confidence rare S-LoFs in autism-associated genes in each sample, stratified by status and family relationship. Error bars correspond to standard errors of the proportions. ORs and P values from two-sided Fisher exact tests comparing children with autism and their siblings in SSC and SPARK samples and individuals with autism and undiagnosed individuals in the iPSYCH sample. P values corrected for multiple testing using Bonferroni method for each variant type and gene set (SSC, n = 2,041 individuals with autism, 1,944 siblings, 2,041 mothers and 2,041 fathers; SPARK, n = 6,239 individuals with autism, 2,344 siblings, 5,559 mothers and 5,559 fathers; iPSYCH, n = 4,811 individuals with autism, 5,214 undiagnosed individuals; UK Biobank (UKB), n = 188,856 undiagnosed individuals). b, Number of S-LoF carriers among individuals with autism and autism OR, which is the enrichment of S-LoFs among individuals with autism compared to undiagnosed individuals (based on 100 sub-samplings of undiagnosed individuals to match the number of individuals with autism; Methods). Genes with autism ORs significantly higher than expected by chance (empirical test based on 10,000 bootstraps; Methods) are shown in red, others in gray. c, Distribution of gene-level autism OR of S-LoFs in autism-associated genes, S-LoFs in constrained genes and S-SYNs in autism-associated genes. Box plots representing minimum, first quartile, median, third quartile and maximum values, with outliers defined as first quartile minus 1.5 × interquartile range and third quartile plus 1.5 × interquartile range. P values are from two-sided Mann–Whitney U-tests.
Fig. 2
Fig. 2. Sex ratio among carriers and non-carriers of S-LoFs in autism-associated genes.
Pie charts of the fraction of male and female individuals among non-carriers and carriers of S-LoFs in autism-associated genes, stratified by status and family relationship. ORs for enrichment of S-LoFs among female over male individuals and corresponding P values from two-sided Fisher exact tests. P values were corrected for multiple testing using the Bonferroni method.
Fig. 3
Fig. 3. Relationship between gene expression profile and autism OR.
a, Correlation between autism OR and gene expression in distinct brain regions and developmental periods for 130 genes for which at least one variant was identified among individuals with autism (expression data for early fetal cerebellum were not available; Methods). Cortical regions were grouped as follows: posterior inferior parietal cortex, primary auditory cortex, primary visual cortex, superior temporal cortex and inferior temporal cortex (P/A/V/T cortex); primary somatosensory cortex, primary motor cortex, orbital prefrontal cortex, dorsolateral prefrontal cortex, medial prefrontal cortex and ventrolateral prefrontal cortex (S/M/P cortex). Correlations and P values measured by two-sided Kendall correlation tests between autism OR and gene expression (*nominal P < 0.05; Supplementary Table 2 shows exact values). b, Distribution of autism OR of autism-associated genes in different brain coexpression modules. Brain coexpression modules were extracted from Voineagu et al.. Modules are ordered according to average autism OR of corresponding genes. Modules were mapped to cell types in the original study. c, Distribution of autism OR of autism-associated genes found exclusively in modules associated with neuron or interneuron cell types and those in modules associated both with neuron/interneuron and other cell types. P values are from two-sided Mann–Whitney U-tests. For ac, we set infinite autism OR values to the highest measurable autism OR in the corresponding gene set.
Fig. 4
Fig. 4. Phenotypic effects of rare variants in autism-associated and constrained genes among diagnosed individuals.
a, OR (for logistic regressions) and β values (for linear regressions) associated with variant presence from multivariable regression analyses of autism diagnosis, SCQ t-score, IQ score bin, autism factors and developmental milestones, stratified by gene type and autism OR of genes carrying the variants (Methods). Regressions performed on individuals from the SSC and SPARK samples. To correct for the biased sex ratio among individuals with autism, with approximately one female to four males, sex was added as a covariate. Error bars correspond to 95% CI. P values associated with each β value were corrected for multiple testing using the false discovery rate (FDR) method (full circles correspond to corrected P < 0.05). The number of individuals with available data is shown for each regression. For age at developmental milestones, age is given in months and higher values indicate higher age. b, Distribution of trait values for IQ score bin and age of first words for carriers and non-carriers of S-LoFs. Vertical lines indicate average values. c, β values associated with autism PGS from multivariable regression analyses of autism diagnosis, SCQ t-score, IQ score bin, autism factors and developmental milestones. β values associated with autism PGS correspond to regression analyses with S-LoFs in constrained genes with autism OR > 10 considered as covariates (Supplementary Tables 4 and 5 show complete results). Regressions performed on individuals from the SSC and SPARK samples. To correct for the biased sex ratio among individuals with autism, with approximately one girl to for boys, sex was added as a covariate. Error bars correspond to 95% CI. P values associated with each β value were corrected for multiple testing using the FDR method (full circles correspond to corrected P < 0.05). The number of individuals with available data is shown for each regression. For age at developmental milestones, age is given in months and higher values indicate higher age. d, Distribution of trait values for IQ score bin and age of first words for individuals in the first, fourth and tenth decile of the autism PGS distribution. Vertical lines indicate average values.
Fig. 5
Fig. 5. Phenotypic effects of rare variants in autism-associated and constrained genes among undiagnosed individuals.
a, Phenome-wide association study of the effect of S-LoFs in autism-associated genes using the PHESANT software on 18,224 traits from the UK Biobank (Methods). P values were corrected for multiple testing using the FDR method and shown for all tested phenotypes (complete results shown in Supplementary Table 6). Traits were classified according to the broad category defined in the UK Biobank database. FVC, forced vital capacity; FEV1, forced expiratory volume in 1 s; PEF, peak expiratory flow. b, OR (logistic regressions) and standardized β values (linear regressions) associated with variant presence and autism PGS from multivariable regression analyses of socioeconomic traits and fluid intelligence, stratified by gene type and autism OR of genes carrying the variants (Methods). The Townsend index measures were reversed so that higher material deprivation was indicated with a negative sign. The β values associated with autism PGS when S-LoFs in constrained genes with autism OR > 10 are considered in the regression analysis are shown (Supplementary Tables 4 and 5 show complete results). Error bars correspond to 95% CI. P values associated with each β value were corrected for multiple testing using the FDR method (full circles correspond to corrected P < 0.05). The number of individuals used in the regression analyses was as follows: fluid intelligence, n = 112,614; income, n = 162,968; qualification, n = 156,483; and Townsend deprivation index, n = 188,630. c, Distribution of incomes and fluid intelligence scores are shown for carriers and non-carriers of S-LoFs in autism-associated genes among undiagnosed UK Biobank individuals.
Fig. 6
Fig. 6. Effect of genetic variants on brain anatomy and participation to questionnaires in the UK Biobank.
a, Distribution of total cortical surface area and thickness for carriers and non-carriers of S-LoFs in autism-associated or constrained genes (left). The values shown were corrected for age, sex and scanning site. Gene symbols are indicated for individuals with surface area or thickness values over 2 standard deviations from the mean (z-scored values <−2 or >2) and carrying S-LoFs in autism-associated genes. Standardized β values associated with variant presence and autism PGS from multivariable regression analyses of brain anatomy among UK Biobank undiagnosed individuals (right). Error bars correspond to 95% CI. Total values for cortical thickness, surface area and volume were measured as the sum of all 68 regions (Methods). S-LoFs in autism-associated and constrained genes were grouped to increase sample size (Supplementary Table 7 shows complete results). P values were corrected for multiple testing using the FDR method. b, OR of participation when carrying a variant among UK Biobank undiagnosed individuals (n = 188,856 individuals) for S-LoFs in autism-associated and constrained genes and for S-SYNs in autism-associated genes. Error bars correspond to 95% CI. P values were corrected for multiple testing using the FDR method for each gene set and variant type independently (full circles indicate corrected P values < 0.05).
Extended Data Fig. 1
Extended Data Fig. 1. Effect of S-LoFs in genes associated to neurodevelopmental disorders in autistic individuals.
(a) Overlap between the autism-associated genes and lists of genes associated to cognitive impairment, epilepsy or neurodevelopmental disorders, cataloged in Leblond et al. Mol Cell Neuro 2021 and updated in-house in March 2022 (left, available at https://genetrek.pasteur.fr/). The distribution of autism OR of genes overlapping with an increasing number of gene sets is shown (right), along with p values from two-sided Mann–Whitney U-tests, corrected for multiple testing using the Bonferroni method. The number of genes in each category is shown. Box plots representing minimum, first quartile, median, third quartile, maximum values, with outliers defined as first quartile minus 1.5 times the interquartile range and third quartile plus 1.5 times the interquartile range. (b) Multivariable regressions restricted to genes annotated as ‘ASD_P’ or ‘ASD_NDD’ in Satterstrom et al. Cell 2020. Legend as in Fig. 4a.
Extended Data Fig. 2
Extended Data Fig. 2. Comparison of autism OR with LoF deleteriousness scores from gnomAD and ClinVar pathogenic variants for autism-associated genes.
The suggested LOEUF threshold of 0.35 (a), pLI threshold of 0.9 (b) and 50% of pathogenic variants that are LoF versus missense variants in ClinVar (c) are shown. (d) Fraction of autism-associated genes passing the thresholds for each metric. Error bars correspond to standard errors of the proportions. (e) Two-sided Pearson correlation coefficients and p values when comparing autism OR, pLI scores, LOEUF scores and fraction of LoFs among ClinVar pathogenic variants. P values were corrected for multiple testing using the FDR method. The ClinVar database (https://www.ncbi.nlm.nih.gov/clinvar/) was downloaded in July 2022, variants annotated as ‘pathogenic’ were extracted and separated between LoF (‘nonsense’, ‘splice_acceptor_variant’, ‘frameshift_variant’, ‘splice_donor_variant’, ‘stop_lost’) and missense variants based on the consequence field.
Extended Data Fig. 3
Extended Data Fig. 3. Gene-level autism OR as a function of number of carrying individuals or families, average pext in brain tissues and relative position in encoded protein.
Proportion of individuals carrying S-LoFs stratified by autism status (top), and corresponding gene-level autism ORs (bottom) as a function of thresholds in pext score, relative position on encoded protein and number of individuals or families. The fraction of undiagnosed individuals carrying S-LoFs corresponds to the average fraction of individuals in the 100 sub-sampling (Methods). Error bars correspond to standard errors of the proportions. The thresholds correspond to S-LoFs that were present in more than 10% of the brain-expressed transcripts, truncating more than 10% of the encoded protein, that is not in the last 10% of the protein sequence, and/or found in only one family or individual. The number of genes for which we find at least one diagnosed individual carrying a variant is indicated. Box plots representing minimum, first quartile, median, third quartile, maximum values, with outliers defined as first quartile minus 1.5 times the interquartile range and third quartile plus 1.5 times the interquartile range. P values from two-sided Mann–Whitney U-tests.
Extended Data Fig. 4
Extended Data Fig. 4. Proportion of individuals carrying S-LoFs in autism-associated genes, S-LoFs in constrained genes or S-SYNs in autism-associated genes.
Proportions are shown in each sample, stratified by status and family relationship. Odds ratios and p values from two-sided Fisher exact tests. Error bars correspond to standard errors of the proportions. P values corrected for multiple testing using Bonferroni method for each variant type and gene set. SSC: Simons Simplex Collection (n = 2,041 individuals with autism, 1,944 siblings, 2,041 mothers and 2,041 fathers), SPARK: Simons Powering Autism Research for Knowledge (n = 6,239 individuals with autism, 2,344 siblings, 5,559 mothers and 5,559 fathers), iPSYCH: The Lundbeck Foundation Initiative for Integrative Psychiatric Research (n = 4,811 individuals with autism, 5,214 undiagnosed individuals), UKB: UK Biobank (n = 188,856 undiagnosed individuals).
Extended Data Fig. 5
Extended Data Fig. 5. Biological pathways associated to high autism OR.
Distribution of autism OR for genes encoding synaptic and transcription proteins compared to autism OR of genes not encoding such proteins. Dots correspond to mean values and error bars to standard deviations. P values from two-sided Mann–Whitney U-tests.
Extended Data Fig. 6
Extended Data Fig. 6. Effect of S-LoFs among syndromic and non-syndromic autistic individuals.
(a) Proportion of individuals carrying S-LoFs among individuals with autism that present no developmental disorder (n = 2,856 individuals) or at least one developmental disorder (n = 3,777 individuals), for S-LoFs in autism-associated genes with autism OR ≤ 10 or autism OR > 10. Odds ratio and p values from two-sided Fisher exact tests. Error bars correspond to 95% confidence intervals. P values corrected for multiple testing using the Bonferroni method. The number of carriers and non-carriers are shown. (b) Multivariable regressions among individuals without developmental disabilities or with at least one developmental disorder. Error bars correspond to 95% confidence intervals. Legend as in Fig. 4a.
Extended Data Fig. 7
Extended Data Fig. 7. Regression analysis for the effect of S-LoFs and autism PGS on autism status and cognitive impairment in the iPSYCH sample.
Odds ratio associated to variant presence and autism PGS from multivariable regression analyses of autism status and cognitive impairment (Methods). The odds ratio associated to autism PGS when S-LoFs in constrained genes with autism OR > 10 are considered in the regression analysis are shown. Error bars correspond to 95% confidence interval. P values associated with each beta value were corrected for multiple testing using the FDR method (full circles indicate corrected p < 0.05). The number of individuals with available data is shown.
Extended Data Fig. 8
Extended Data Fig. 8. Regression results for socioeconomic and cognitive traits in different socioeconomic and cognitive strata.
Odds ratio (logistic regressions) and standardized beta values (linear regressions) associated to variant presence and autism PGS from multivariable regression analyses of socioeconomic traits and fluid intelligence, stratified by gene type and autism OR of genes carrying the variants, alternatively focusing on individuals within low and high range of values for each feature (Methods). For the Townsend index and fluid intelligence, the median of the distribution of values among S-LoF carriers was used to split the dataset (respectively z-scored reversed Townsend index of 0. 12092671 and fluid intelligence score of −0.10951938). For income, we chose to split individuals below and above £31,000, and for qualification below and above A levels or equivalent. This procedure allowed to split individual carrying S-LoFs into two partitions of approximately the same size. Error bars correspond to 95% confidence interval. Legend as in Fig. 5b.
Extended Data Fig. 9
Extended Data Fig. 9. Brain maps showing the standardized beta coefficients associated to variant presence and autism PGS.
Standardized beta coefficients associated to variant presence and autism PGS from multivariable linear regression analyses of brain sub-regions. P values were corrected for multiple testing using the FDR method, and only sub-regions with corrected p values below 0.05 are shown. Beta coefficients from the two hemisphere and from the three metrics were merged, and corresponding hemispheres and metrics for each sub-region are displayed.
Extended Data Fig. 10
Extended Data Fig. 10. Autism OR among male and female individuals.
(a) For each autism-associated gene, the autism OR among male individuals is compared to the autism OR among female individuals. Some genes were not found mutated among either male or female individuals with autism. The gene-level autism OR was measured using the sub-sampling procedure described in Methods, randomly selecting 1,596 and 6,683 individuals, that is the total number of female and male individuals with autism in the studied sample, for each autism status 100 times. For genes on the X chromosome (highlighted in red), we selected genes with dominant mode of inheritance for female individuals (for example MECP2), and we did not filter for inheritance mode for male individuals. (b) Fraction of individuals with autism (left) and male:female ratio (right) stratified by S-LoF presence and autism PGS. S-LoFs were divided between those identified in genes with autism OR below or above 10, and autism PGS was divided into terciles. For male/female ratios, the estimated numbers are shown.

Comment in

References

    1. Bourgeron T. From the genetic architecture to synaptic plasticity in autism spectrum disorder. Nat. Rev. Neurosci. 2015;16:551–563. - PubMed
    1. Grove J, et al. Identification of common genetic risk variants for autism spectrum disorder. Nat. Genet. 2019;51:431–444. - PMC - PubMed
    1. Krumm N, et al. Excess of rare, inherited truncating mutations in autism. Nat. Genet. 2015;47:582–588. - PMC - PubMed
    1. Feliciano P, et al. Exome sequencing of 457 autism families recruited online provides evidence for autism risk genes. NPJ Genom. Med. 2019;4:19. - PMC - PubMed
    1. Myers SM, et al. Insufficient evidence for ‘autism-specific’ genes. Am. J. Hum. Genet. 2020;106:587–595. - PMC - PubMed

Publication types