Randomized Controlled Trial
. 2023 Jul;5(7):1221-1235.
doi: 10.1038/s42255-023-00829-4. Epub 2023 Jun 26.

Dietary weight loss-induced improvements in metabolic function are enhanced by exercise in people with obesity and prediabetes

Affiliations
Randomized Controlled Trial

Dietary weight loss-induced improvements in metabolic function are enhanced by exercise in people with obesity and prediabetes

Joseph W Beals et al. Nat Metab. 2023 Jul.

Abstract

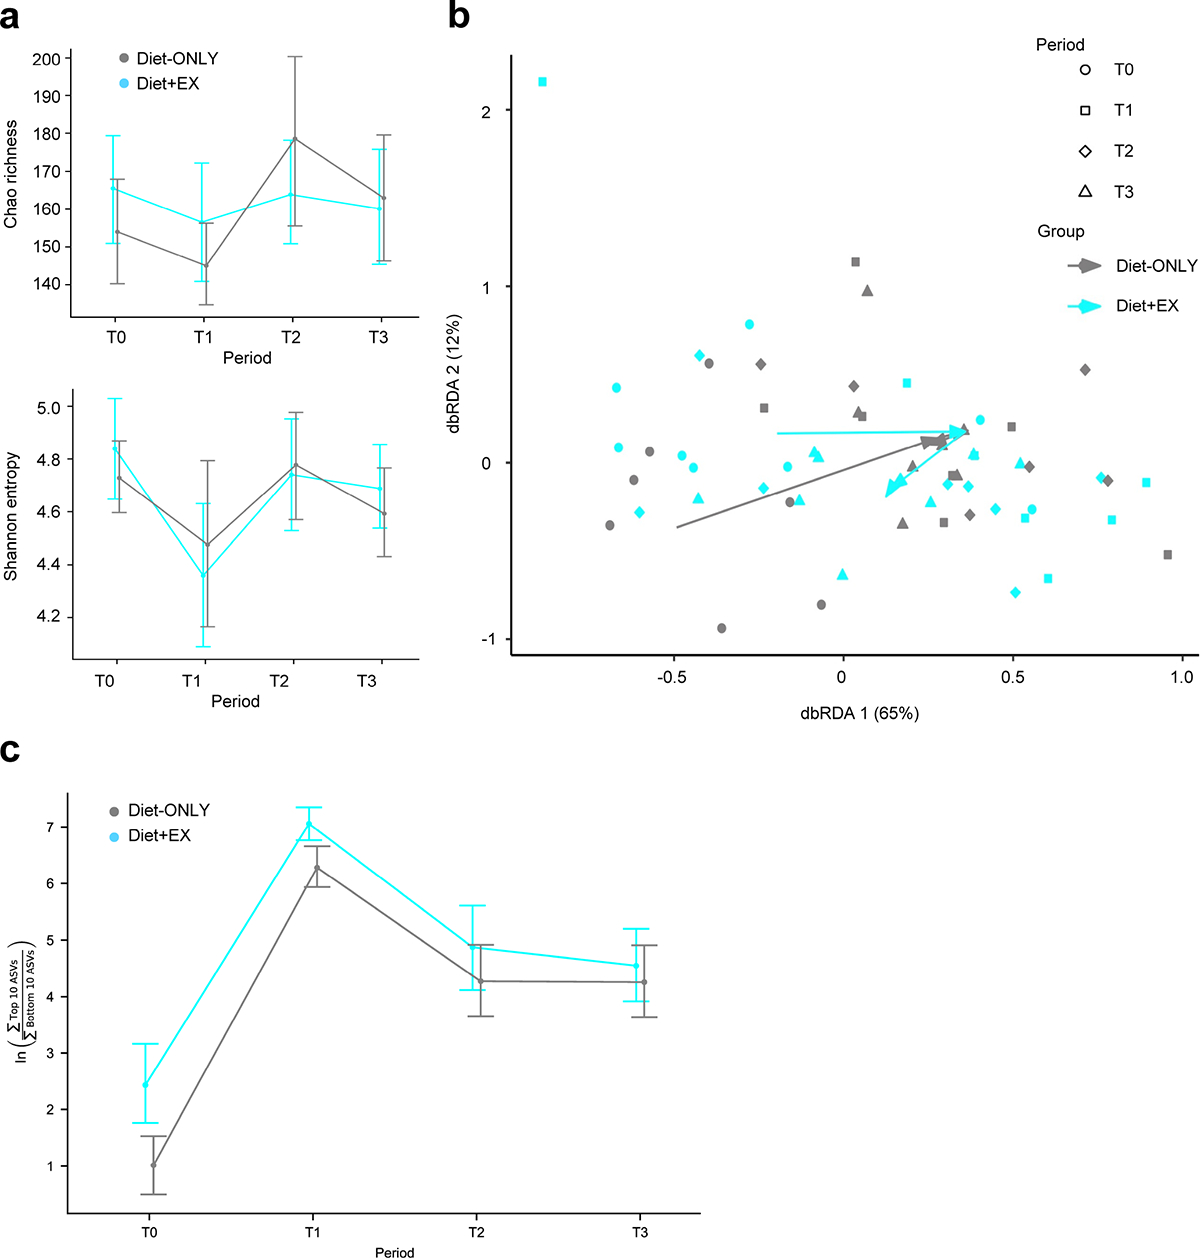
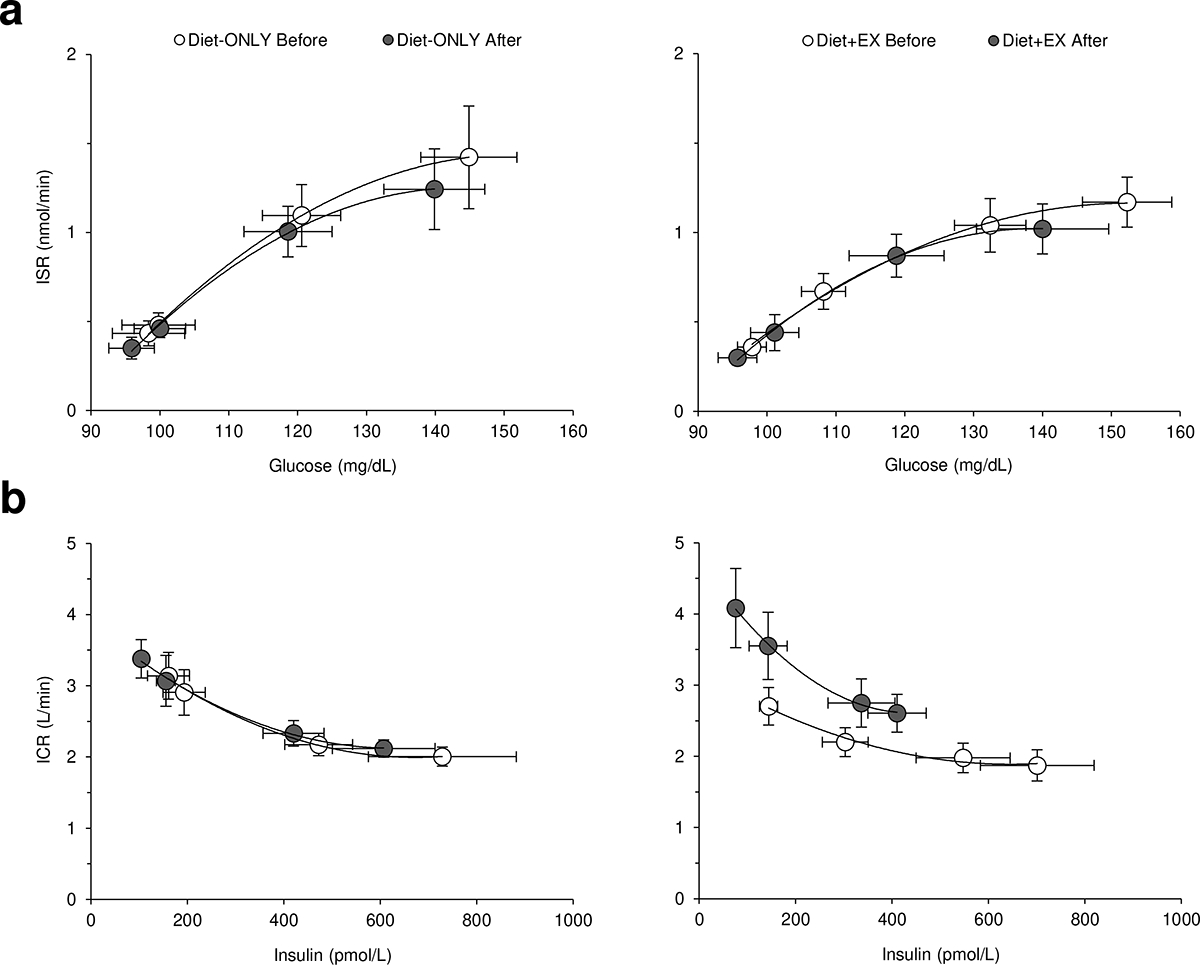
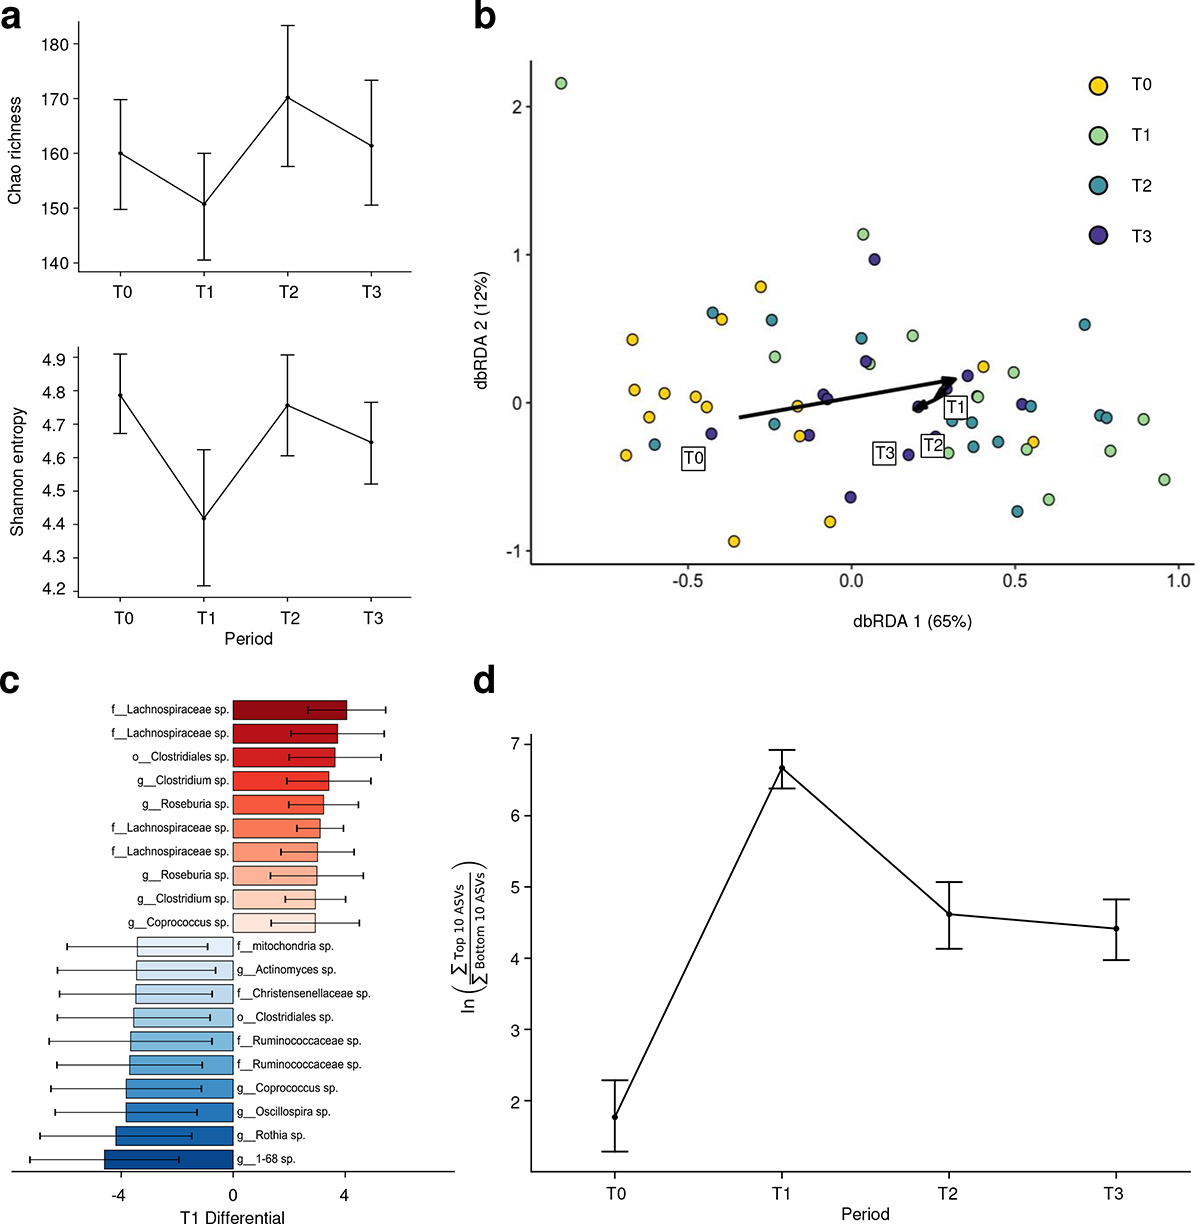
The additional therapeutic effects of regular exercise during a dietary weight loss program in people with obesity and prediabetes are unclear. Here, we show that whole-body (primarily muscle) insulin sensitivity (primary outcome) was 2-fold greater (P = 0.006) after 10% weight loss induced by calorie restriction plus exercise training (Diet+EX; n = 8, 6 women) than 10% weight loss induced by calorie restriction alone (Diet-ONLY; n = 8, 4 women) in participants in two concurrent studies. The greater improvement in insulin sensitivity was accompanied by increased muscle expression of genes involved in mitochondrial biogenesis, energy metabolism and angiogenesis (secondary outcomes) in the Diet+EX group. There were no differences between groups in plasma branched-chain amino acids or markers of inflammation, and both interventions caused similar changes in the gut microbiome. Few adverse events were reported. These results demonstrate that regular exercise during a diet-induced weight loss program has profound additional metabolic benefits in people with obesity and prediabetes.Trial Registration: ClinicalTrials.gov (NCT02706262 and NCT02706288).


Figures

Extended Data Fig. 1.
Schematic diagrams of overall study protocol (a), schedule of individual assessments before (b) and after (c) the intervention and the protocol for inpatient 24-h study blood sampling schedule and hyperinsulinemic-euglycemic clamp procedure (HECP) plus muscle biopsy (Bx) (d). Blood sample timepoints are indicated by arrows and running figure indicates time of a 60-min bout of exercise performed in the Diet+EX group after the intervention. M=meal.
Extended Data Fig. 2.
Extended Data Fig. 2.. Effect of each intervention on the gut microbiome.
Measures of alpha diversity using both Chao richness (top) and Shannon entropy (bottom), before (T0) and at ~1 month (T1, 5.2 ± 0.7% weight loss), ~2 months (T2, 8.6 ± 0.8% weight loss), and ~4–5 months (T3, 10.5 ± 2.7% weight loss) after starting the intervention in the Diet-ONLY (n=7) and Diet+EX (n=8) groups. Data are means ± SEM (a). Beta diversity using Distanced-based Redundancy Analysis of the weight UniFrac distance, conditional on the between-person variability (b). Log-ratio analysis of 10 ASVs that increased the most and the 10 ASVs that decreased the most from T0 to T1 with treatment groups combined shown over time when stratified by study group. Data are log-ratio means ± SEM (c).
Extended Data Fig. 3.
Flow of study participants.
Fig. 1.
Fig. 1.. Glucose and insulin responses to glucose ingestion.
Plasma concentrations and areas under the curve (AUC) for glucose (a), insulin (b), insulin secretion rate (ISR) (c) and insulin clearance rate (ICR) (d) in response to glucose ingestion in the Diet-ONLY (n=7) and Diet+EX (n=8) groups before (white circles and bars) and after ~10% weight loss (gray circles and bars). Data are means ± SEM. Analyses of covariance with baseline values as covariates were used to compare weight loss-induced changes in AUCs between groups. Two-sided ANCOVA without correction for multiple comparisons: *P=0.008 vs. Diet-ONLY value.
Fig. 2.
Fig. 2.. 24-hour plasma glucose, insulin and nonesterified fatty acid dynamics.
Plasma concentrations and areas under the curve (AUC) for glucose (a), insulin (b), insulin secretion rate (ISR) (c), insulin clearance rate (ICR) (d), and nonesterified fatty acids (NEFA) (e) obtained over 24 hours in the Diet-ONLY (n=8) and Diet+EX (n=7) groups before (white circles and bars) and after ~10% weight loss (gray circles and bars). Gray vertical bars and running figure indicate time of mixed-meal ingestion and a 60-min bout of exercise performed in the Diet+EX group after ~10% weight loss, respectively. Detailed timeline is presented in Extended Data Fig. 1. Data are means ± SEM. Analyses of covariance with baseline values as covariates were used to compare weight loss-induced changes in AUCs between groups. Two-sided ANCOVA without correction for multiple comparisons: *P=0.030, 0.009 and 0.003 vs. Diet-ONLY value for plasma insulin, ICR and plasma NEFA AUCs, respectively.
Fig. 3.
Fig. 3.. β-cell function and insulin clearance during the first 30 minutes of the oral glucose tolerance test.
Relationships between plasma glucose concentration and insulin secretion rate (ISR) (c), and plasma insulin concentration and insulin clearance rate (ICR) (b) before and during the first 30 minutes after ingesting 75 g of glucose in the Diet-ONLY (n=7) and Diet+EX (n=8) groups before (white circles) and after ~10% weight loss (gray circles). Data are means ± SEM.
Fig. 4.
Fig. 4.. Effect of Diet-ONLY and Diet+EX on insulin sensitivity.
Whole-body (primarily muscle) insulin sensitivity (glucose disposal rate per kilogram fat-free mass (FFM) divided by plasma insulin concentration during the hyperinsulinemic-euglycemic clamp procedure) (a), hepatic insulin sensitivity index (the reciprocal of the product of endogenous glucose production rate per kilogram FFM and plasma insulin concentration during basal conditions) (b), and the Matsuda insulin sensitivity index (10,000 divided by the square root of the product of plasma glucose and insulin concentrations during the basal state and mean plasma glucose and insulin concentrations at 30, 60, 90 and 120 min during the oral glucose tolerance test) (c) in the Diet-ONLY (n=8 in panels a and b, and n=7 in panel c) and Diet+EX (n=8 for all panels) groups before (white bars) and after ~10% weight loss (gray bars). Data are means ± SEM. Analyses of covariance with baseline values as covariates were used to compare weight loss-induced changes in AUCs between groups. Two-sided ANCOVA without correction for multiple comparisons: *P=0.006, 0.014 and 0.037 vs. Diet-ONLY value for whole-body insulin sensitivity, hepatic insulin sensitivity and Matsuda insulin sensitivity index, respectively.
Fig. 5.
Fig. 5.. Skeletal muscle RNA sequencing.
Skeletal muscle tissue obtained in the Diet-ONLY (n=6) and Diet+EX (n=7) groups before and after weight loss were evaluated by using RNA-sequencing (RNA-seq). Volcano plots of skeletal muscle RNA-seq data with log2-fold change (FC) (X-axis) and two-sided −log10false discovery rate (FDR) (Y-axis) (a). The number of differentially expressed genes (DEGs, |log2FC | >0.3 and two-sided FDR<0.05) between before and after weight loss in each group is shown. Biological pathways significantly (two-sided FDR<0.01) enriched with upregulated DEGs between before and after weight loss in the Diet+EX group (b). Expression of key genes that regulate mitochondrial biogenesis and energy metabolism, (c; peroxisome proliferator-activated receptor γ coactivator 1 α, PPARGC1A; mitochondrial fission factor, MFF; citrate synthase, CS; malate dehydrogenase 1, MDH1; cytochrome C somatic, CYCS; ATP Synthase F1 Subunit α, ATP5F1A; very long-chain and medium-chain specific acyl-CoA dehydrogenases, ACADVL and ACADVM, respectively; Lipoprotein lipase, LPL; and Cluster of differentiation 36, CD36) and expression of genes involved in regulating angiogenesis (d; vascular endothelial growth factor α, VEGFA; vascular endothelial growth factor receptor 2, KDR) in the Diet-ONLY and Diet+EX groups before (white bars) and after ~10% weight loss (gray bars). Data in panels C and D are median (central horizontal line), 25th and 75th percentiles (box) and minimum and maximum values (vertical lines) and outliers (circles), and were analyzed by using analyses of covariance with baseline values as covariates to compare weight loss-induced changes between groups. Two-sided ANCOVA without adjustment for multiple comparisons: *P=0.001, 0.009, <0.001, 0.007, 0.003, 0.030, 0.024, 0.001, 0.006, 0.001, 0.004, <0.001 vs. Diet-ONLY value for PPARGC1A, MFF, CS, MDH1, CYCS, ATP5F1A, ACADVL, ACADVM, LPL, CD36, VEGFA, and KDR respectively.
Fig. 6.
Fig. 6.. Changes in the plasma proteome.
Volcano plots of proteins with differential abundance after weight loss in the Diet-ONLY (n=8) and Diet+EX groups (n=8) (a). Functional enrichment analyses were performed to identify biological pathways significantly enriched (two-sided Padj<0.20) with proteins with differential abundance after weight loss. The top 5 most significantly enriched pathways in the GO Biological process and Cellular component databases in the Diet+EX group and the corresponding changes in the Diet-ONLY group. Vertical dashed lines represent two-sided Log10Padj<0.05 (b). Plasma proteins related to mitochondrial biology and energy metabolism (mitochondrial import inner membrane translocase subunit TIM50, TIMM50; mitochondrial dihydrolipoyl dehydrogenase, DLD; bolA-like protein 3, BOLA3; enoyl CoA hydratase 1, ECH1; citrate synthase, CS; translational activator of cytochrome c oxidase 1, TACO1; ETS domain-containing protein Elk-3, ELK3; 2,4-dienoyl-CoA reductase 1, DECR1; transglutaminase 2, TGM2; mitochondrial peptidyl-prolyl cis-trans isomerase F, PPIF; fatty acid binding protein 3, FABP3; lactate dehydrogenase B, LDHB) that significantly increased (Padj<0.20) after the intervention in conjunction with a significant (two-sided FDR P<0.05) increase in skeletal muscle expression of the encoding genes in the Diet+EX group (c). Differential abundance of each protein from Before to After weight loss in each group was tested by using empirical Bayes moderated paired t-tests and P-values were adjusted by using the Benjamini-Hochberg method and a two-sided Padj <0.20 was considered significant.
Fig. 7.
Fig. 7.. Changes in gut microbiota.
Measures of alpha diversity using both Chao richness (top) and Shannon entropy (bottom), before (T0) and at ~1 month (T1, 5.2 ± 0.7% weight loss), ~2 months (T2, 8.6 ± 0.8% weight loss), and ~4–5 months (T3, 10.5 ± 2.7% weight loss) after starting the intervention all participants (all panels are n=15; Diet-ONLY n=7 and Diet+EX n=8). Data are means ± SEM (a). Beta diversity using Distanced-based Redundancy Analysis of the weight UniFrac distance, conditional on the between-person variability (b). Differential abundance results of the 10 ASVs that increased the most and the 10 ASVs that decreased the most from T0 to T1 with treatment groups combined. Red and Blue colored bars represent posterior mean values ± SD (c). Log-ratio analysis of top and bottom 10 ASVs shown in panel c over time with both groups combined. Data are log-ratio means ± SEM (d).

References

    1. Klein S, Wadden T & Sugerman HJ AGA technical review on obesity. Gastroenterology 123, 882–932 (2002). - PubMed
    1. Magkos F et al. Effects of moderate and subsequent progressive weight loss on metabolic function and adipose tissue biology in humans with obesity. Cell Metabolism 23, 591–601 (2016). - PMC - PubMed
    1. Perseghin G et al. Increased glucose transport–phosphorylation and muscle glycogen synthesis after exercise training in insulin-resistant subjects. N Engl J Med 335, 1357–1362 (1996). - PubMed
    1. Devlin JT & Horton ES Effects of prior high-intensity exercise on glucose metabolism in normal and insulin-resistant men. Diabetes 34, 973–979 (1985). - PubMed
    1. Ding C et al. Dose-dependent effects of exercise and diet on insulin sensitivity and secretion. Med Sci Sports Exerc 51, 2109–2116 (2019). - PubMed

Publication types

Associated data