. 2023 Jun 26;24(1):150.
doi: 10.1186/s13059-023-02993-y.

Transcriptome- and proteome-wide association studies nominate determinants of kidney function and damage

Affiliations

Transcriptome- and proteome-wide association studies nominate determinants of kidney function and damage

Pascal Schlosser et al. Genome Biol. .

Abstract

Background: The pathophysiological causes of kidney disease are not fully understood. Here we show that the integration of genome-wide genetic, transcriptomic, and proteomic association studies can nominate causal determinants of kidney function and damage.

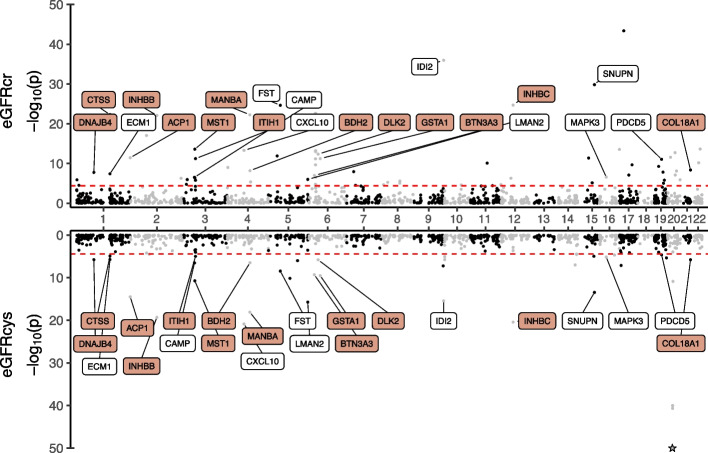
Results: Through transcriptome-wide association studies (TWAS) in kidney cortex, kidney tubule, liver, and whole blood and proteome-wide association studies (PWAS) in plasma, we assess for effects of 12,893 genes and 1342 proteins on kidney filtration (glomerular filtration rate (GFR) estimated by creatinine; GFR estimated by cystatin C; and blood urea nitrogen) and kidney damage (albuminuria). We find 1561 associations distributed among 260 genomic regions that are supported as putatively causal. We then prioritize 153 of these genomic regions using additional colocalization analyses. Our genome-wide findings are supported by existing knowledge (animal models for MANBA, DACH1, SH3YL1, INHBB), exceed the underlying GWAS signals (28 region-trait combinations without significant GWAS hit), identify independent gene/protein-trait associations within the same genomic region (INHBC, SPRYD4), nominate tissues underlying the associations (tubule expression of NRBP1), and distinguish markers of kidney filtration from those with a role in creatinine and cystatin C metabolism. Furthermore, we follow up on members of the TGF-beta superfamily of proteins and find a prognostic value of INHBC for kidney disease progression even after adjustment for measured glomerular filtration rate (GFR).

Conclusion: In summary, this study combines multimodal, genome-wide association studies to generate a catalog of putatively causal target genes and proteins relevant to kidney function and damage which can guide follow-up studies in physiology, basic science, and clinical medicine.

Keywords: ACR; BUN; Chronic kidney disease; End-stage kidney disease; GWAS; Genetics; Nephrology; PWAS; Proteomics; TWAS; Transcriptomics; eGFR.


Conflict of interest statement

The authors declare that they have no competing interests.

Figures

Fig. 1
Fig. 1
Workflow of integrated transcriptome-wide and proteome-wide association studies of kidney function and damage. We performed TWAS (gray boxes) and PWAS (orange box) using genetic instruments to model life-long differences in transcript expression and protein abundance and their effect on kidney function and damage (eGFRcr, eGFRcys, BUN, and ACR). Significant TWAS / PWAS associations which additionally displayed statistical colocalization of the kidney function / damage GWAS and the transcript / protein GWAS (eQTLs, pQTLs) were moved forward and compared across genomic regions and kidney function traits. Conditional analyses were used to prioritize genes and tissues of origin per genomic region. Putative treatment targets were pharmacologically annotated. Icon credit: Servier Medical Art by Servier (licensed under a Creative Commons Attribution 3.0 Unported License)
Fig. 2
Fig. 2
TWAS analyses highlight gene expression in kidney-related tissues consistent with genetic determinants of both eGFRcr and eGFRcys. Genes that were significant for the estimated glomerular filtration rate based on creatinine (eGFRcr) and for the estimated glomerular filtration rate based on cystatin (eGFRcys) and that were additionally supported by colocalization analyses of eGFR and expression quantitative trait loci (posterior probability > 0.8) were labeled. The color code indicates the tissue of the TWAS model and − log10(P-values) were capped at 50 (associations indicated by stars). The red lines indicate the Bonferroni adjusted significance threshold (P < 3.9 × 106)
Fig. 3
Fig. 3
PWAS analyses identify circulating proteins consistent with genetic determinants of both eGFRcr and eGFRcys. Proteins that were significant for both the estimated glomerular filtration rate based on creatinine (eGFRcr) and for the estimated glomerular filtration rate based on cystatin (eGFRcys) were labeled. Proteins with additional support through colocalization analyses of eGFR and protein quantitative trait loci (posterior probability > 0.8, “Methods”) were highlighted in orange and − log10(P-values) were capped at 50 (stronger associations indicated as stars). The red lines indicate the Bonferroni adjusted significance threshold (P < 3.7 × 105)
Fig. 4
Fig. 4
Shared and distinct genomic regions underlying the kidney function and damage markers. a Venn diagram of the 153 genomic regions identified through TWAS/PWAS and additionally supported by colocalization across eGFRcr, eGFRcys, BUN, and ACR. For intersections with less than five regions, the prioritized genes instead of the number regions were listed. Multiple independent genes pertaining to the same region were separated by an ampersand. b Regional association plot for the shared association of the filtration markers represented by eGFRcr that corresponds to independent associations with plasma INHBC protein levels (conditional independent signal) and whole blood SPRYD4 expression (marginal statistics). The gray dashed line indicates genome-wide significance (5 × 108) on the eGFRcr/SPRYD4 y-axis. INHBC p-values are plotted on a separate y-axis. Expression quantitative trait loci (QTLs) and protein QTLs were annotated by the posterior inclusion probabilities of SNPs being the driving variant in the region (dot size, “Methods”)
Fig. 5
Fig. 5
Regional association plot of the single signal in the ACP1 / SH3YL1 region. a Regional association plot for the shared association of the filtration markers represented by eGFRcr that identified the same association for plasma ACP1 protein levels (independent signal indexed by rs79716074) and tubule SH3YL1 expression (marginal statistics). The gray dashed line indicates genome-wide significance (5 × 10−8) on the eGFRcr/SH3YL1 y-axis. ACP1 p-values are plotted on a separate y-axis. SNPs were annotated by the posterior probabilities of them being the driving variant in the region (dot size, “Methods”). b Single-cell RNA sequencing levels across kidney cell types of SH3YL1 and ACP1 in the Kidney Precision Medicine Project (KPMP) are displayed. KPMP acute kidney injury samples were excluded

References

    1. Levey AS, Coresh J. Chronic kidney disease. Lancet. 2012;379:165–180. doi: 10.1016/S0140-6736(11)60178-5. - DOI - PubMed
    1. Eckardt KU, et al. Evolving importance of kidney disease: from subspecialty to global health burden. Lancet. 2013;382:158–169. doi: 10.1016/S0140-6736(13)60439-0. - DOI - PubMed
    1. Stevens, P.E., Levin, A. & Kidney Disease: Improving Global Outcomes Chronic Kidney Disease Guideline Development Work Group, M. Evaluation and management of chronic kidney disease: synopsis of the kidney disease: improving global outcomes 2012 clinical practice guideline. Ann Intern Med. 2013; 158: 825–30. - PubMed
    1. Matias-Garcia, P. et al. Plasma proteomics of renal function: a trans-ethnic meta-analysis and Mendelian randomization study. J Am Soc Nephrol. 2021. - PMC - PubMed
    1. Suhre K, et al. Connecting genetic risk to disease end points through the human blood plasma proteome. Nat Commun. 2017;8:14357. doi: 10.1038/ncomms14357. - DOI - PMC - PubMed

Publication types