. 2023 Nov 27;15(6):mjad041.
doi: 10.1093/jmcb/mjad041.

Dynamic phosphorylation of CENP-N by CDK1 guides accurate chromosome segregation in mitosis

Affiliations

Dynamic phosphorylation of CENP-N by CDK1 guides accurate chromosome segregation in mitosis

Ran Liu et al. J Mol Cell Biol. .

Abstract

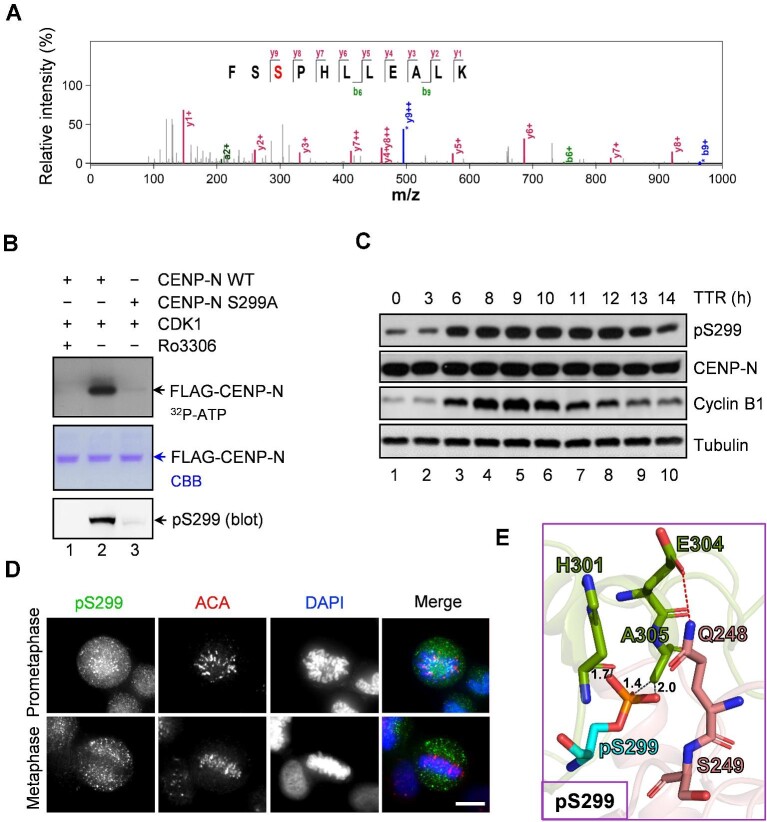
In mitosis, accurate chromosome segregation depends on the kinetochore, a supermolecular machinery that couples dynamic spindle microtubules to centromeric chromatin. However, the structure-activity relationship of the constitutive centromere-associated network (CCAN) during mitosis remains uncharacterized. Building on our recent cryo-electron microscopic analyses of human CCAN structure, we investigated how dynamic phosphorylation of human CENP-N regulates accurate chromosome segregation. Our mass spectrometric analyses revealed mitotic phosphorylation of CENP-N by CDK1, which modulates the CENP-L-CENP-N interaction for accurate chromosome segregation and CCAN organization. Perturbation of CENP-N phosphorylation is shown to prevent proper chromosome alignment and activate the spindle assembly checkpoint. These analyses provide mechanistic insight into a previously undefined link between the centromere-kinetochore network and accurate chromosome segregation.

Keywords: CDK1; CENP-N; centromere; mitosis; phosphorylation.


Figures

Figure 1
Figure 1
The interaction between CENP-L and CENP-N is required for accurate mitotic progression. (A) The binding interface between CENP-L and CENP-N. A close-up view of the key β-strand of CENP-N at the CENP-L–CENP-N interface is shown in magenta. (B) Immunoprecipitation analyses show that the TAT-CENP-N271–300 peptide disrupts the interaction between CENP-L and CENP-N. (C) Disrupting the CENP-L–CENP-N interaction causes chromosome misalignment. Representative images illustrating mitotic progression in mCherry-H2B-expressing cells treated with scramble control peptide or 5 μM TAT-CENP-N271–300 peptide in Opti-MEM for 60 min. Live cell imaging analyses were performed under a DeltaVision microscope. Images were acquired at the indicated time points after the start of nuclear envelope breakdown (control: n = 25, TAT-CENP-N271–300: n = 34). Scale bar, 10 μm. (D) Bar graphs illustrating the percentages of various phenotypes of cells treated as in C.
Figure 2
Figure 2
Analysis of potential phosphorylation sites at the CENP-L–CENP-N interface. (A) The overall structure of the CENP-L–CENP-N heterodimer with three residues that may be phosphorylated (Thr273, Ser299, and Ser320 labelled by different colored boxes). The enlarged view shows details of the interaction between CENP-L and CENP-N at Thr273, Ser299, and Ser320, respectively. Hydrogen bonds are indicated by red dashed lines. The gray dashed lines mark the distance between the hydroxyl group of Ser299 and its neighboring residues. (B) HEK293T cells were co-transfected with FLAG-CENP-L and wild-type GFP-CENP-N or different GFP-CENP-N mutants as indicated. GFP-Mis12 served as a negative control. After 24 h, the cells were collected and lysed, and immunoprecipitation was carried out using anti-FLAG M2 beads. Immunoprecipitation samples were examined by western blotting using anti-GFP, anti-FLAG, and anti-β-actin antibodies, respectively. WCL, whole-cell lysate. (C) Representative immunofluorescence images of cells expressing wild-type GFP-CENP-N or different GFP-CENP-N mutants as indicated. Cells were treated with S-trityl-L-cysteine, an EG5 inhibitor, for 4 h and then fixed and stained for ACA (red) and DNA (blue). Scale bar, 10 μm. ACA, anti-centromere antibody. (D) Bar graph illustrating the relative fluorescence intensity of CENP-N in cells treated as in C. Bars represent the mean kinetochore intensity (± standard deviation) normalized to the values of the GFP-CENP-N wild-type group. Each dot represents one cell (>30 cells from three independent experiments). Student's t-test was used to calculate P-values. ****P < 0.0001.
Figure 3
Figure 3
CENP-N is a novel physiological substrate of CDK1. (A) Mass spectrum of phosphorylation sites of CENP-N in mitotic cells. FLAG-CENP-N was isolated from mitotic HeLa lysates by immunoprecipitation. After extensive washes, the beads were subjected to mass spectrometric analyses. (B) In vitro phosphorylation of recombinant 3× FLAG-tagged wild-type CENP-N or CENP-N S299A by CDK1 in the absence or presence of the CDK1 inhibitor Ro3306. The upper panel shows the result of autoradiography; the middle panel shows CBB staining of the gel; and the lower panel shows the result of western blotting probed with anti-CENP-N pS299 antibody. (C) Temporal profile of CENP-N Ser299 phosphorylation during the cell cycle. HeLa cells were synchronized by a double thymidine block and then released and collected at the selected time points. Cell lysate samples were resolved by sodium dodecyl sulfate–polyacrylamide gel electrophoresis (SDS–PAGE) and analyzed by western blotting using anti-CENP-N pS299, anti-CENP-N, anti-Cyclin B1, and anti-tubulin antibodies, respectively. TTR, double thymidine release. (D) Immunofluorescence staining for pS299 of CENP-N, ACA, and DNA in prometaphase or metaphase HeLa cells. Note that the pS299 signal is strong at the prometaphase centromere but diminished in metaphase cells. Scale bar, 10 μm. (E) An enlarged view of the intricate CENP-L–CENP-N interface in the aftermath of phosphorylation at CENP-N Ser299. Noticeable red dashed lines signify the hydrogen bonds, while the gray dashed lines depict the distance between the phosphate group on Ser299 and other surrounding atoms that could lead to potential conflicts.
Figure 4
Figure 4
Perturbation of CENP-N phosphorylation impairs CCAN mechano-sensitivity. (A) Inducible CRISPR/Cas9-mediated endogenous CENP-N knockout HeLa cells were infected with lentiviruses expressing sgRNA-resistant GFP-tagged CENP-N protein. Western blotting analysis was performed to evaluate the endogenous and exogenous CENP-N protein levels. KO, knockout. (B) Real-time imaging of endogenous CENP-N knockout HeLa cells expressing GFP-tagged wild-type CENP-N or GFP-tagged CENP-N mutants. Note that both S299A and S299D cause mitotic arrest with chromosome alignment defects. Chromosomes are marked by mCherry-H2B. Scale bar, 10 μm. (C) Quantification of mitotic phenotypes in cells treated as in B. Approximately 50 cells were counted for each group. (D) Real-time imaging of endogenous CENP-N knockout HeLa cells expressing the non-phosphorylatable CENP-N S299A mutant. S299A-caused mitotic arrest activates the spindle assembly checkpoint. The addition of reversine releases the spindle assembly checkpoint and mitotic blockage. Chromosomes are marked by mCherry-H2B. SAC, spindle assembly checkpoint. Scale bar, 10 μm.
Figure 5
Figure 5
CENP-N phosphorylation couples kinetochore plasticity to CCAN mechano-sensitivity. (A) Immunofluorescence staining for the checkpoint protein Mad2 and the centromere marker Hec1 in cells expressing wild-type CENP-N or the CENP-N S299A mutant. In cells expressing the CENP-N S299A mutant (bottom panel), Mad2 labelling is restricted to chromosomes scattered near the poles. Scale bar, 10 μm. (B) Quantitation of the distance between sister kinetochores shown in A. The distance between sister kinetochores, as marked by Hec1 staining situated in the same focal plane, was determined using 100 kinetochores selected from at least 10 different cells. See ‘Materials and methods’ for details. (C) A working model illustrating the stepwise and dynamic assembly of CCAN to the centromere during the G1, S, and early G2 phases, resulting in the formation of a stable CENP-L–CENP-N channel required for the completion of CCAN assembly. Upon phosphorylation of CENP-N by CDK1, the CENP-L–CENP-N channel opens, allowing for the remodeling of CCAN and the binding of CENP-L–CENP-N to multiple sites on the centromeric DNA. This leads to tension development across sister kinetochores and within the same kinetochore, which is necessary for spindle assembly checkpoint satisfaction and accurate chromosome segregation.

References

    1. Ariyoshi M., Makino F., Watanabe R. et al. (2021). Cryo-EM structure of the CENP-A nucleosome in complex with phosphorylated CENP-C. EMBO J. 40, e105671. - PMC - PubMed
    1. Bao X., Liu H., Liu X. et al. (2018). Mitosis-specific acetylation tunes Ran effector binding for chromosome segregation. J. Mol. Cell Biol. 10, 18–32. - PMC - PubMed
    1. Carroll C.W., Silva M.C., Godek K.M. et al. (2009). Centromere assembly requires the direct recognition of CENP-A nucleosomes by CENP-N. Nat. Cell Biol. 11, 896–902. - PMC - PubMed
    1. Cheeseman I.M., Desai A. (2008). Molecular architecture of the kinetochore–microtubule interface. Nat. Rev. Mol. Cell Biol. 9, 33–46. - PubMed
    1. Chittori S., Hong J., Saunders H. et al. (2018). Structural mechanisms of centromeric nucleosome recognition by the kinetochore protein CENP-N. Science 359, 339–343. - PMC - PubMed

Publication types