

Published Erratum
doi: 10.1093/brain/awad208.
Correction to: Brain-derived tau: a novel blood-based biomarker for Alzheimer's disease-type neurodegeneration
- PMID: 37365902
- PMCID: PMC10545495
- DOI: 10.1093/brain/awad208
Item in Clipboard
Published Erratum
Correction to: Brain-derived tau: a novel blood-based biomarker for Alzheimer's disease-type neurodegeneration
Brain.
.
No abstract available
Figures
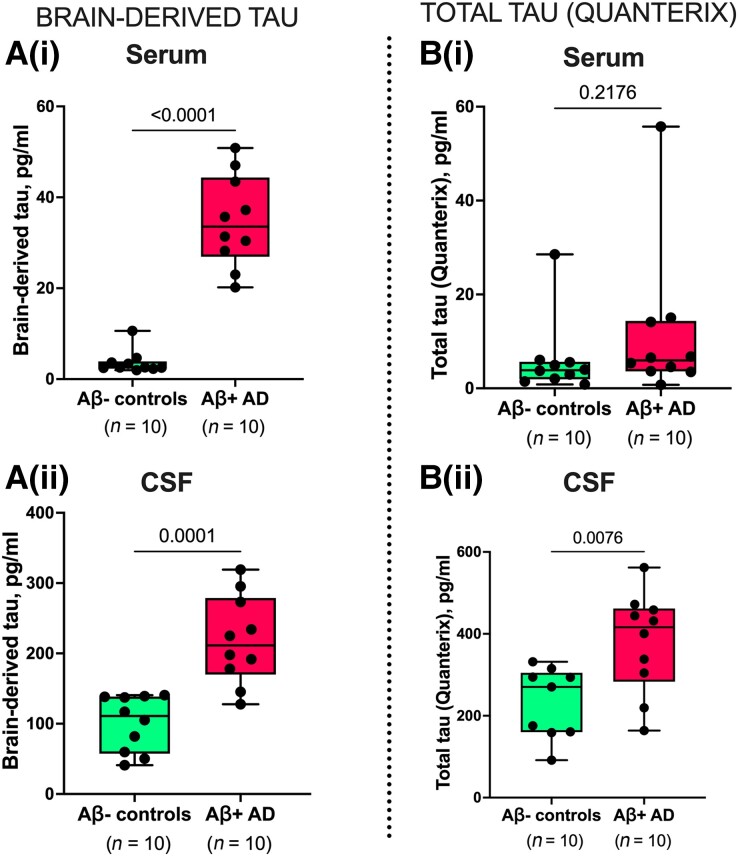
Concentrations and correlation of BD-tau in paired serum and CSF samples. [A(i and ii)] Concentrations of BD-tau in paired serum and CSF samples showing significant increases in Aβ+ Alzheimer’s disease and Aβ− control individuals classified according to their neurochemical CSF biomarker profiles. The corresponding levels of t-tau (Quanterix) in the same paired serum and CSF samples are shown in B(i) and B(ii), respectively. P-values indicate the results of Mann–Whitney tests. In each box plot, the horizontal bar on top of the coloured area shows the 75% percentile, the middle bar depicts the median and the lower bar shows the 25% percentile. Values that are above the 75% percentile and below the 25% percentile are shown outside the coloured areas.
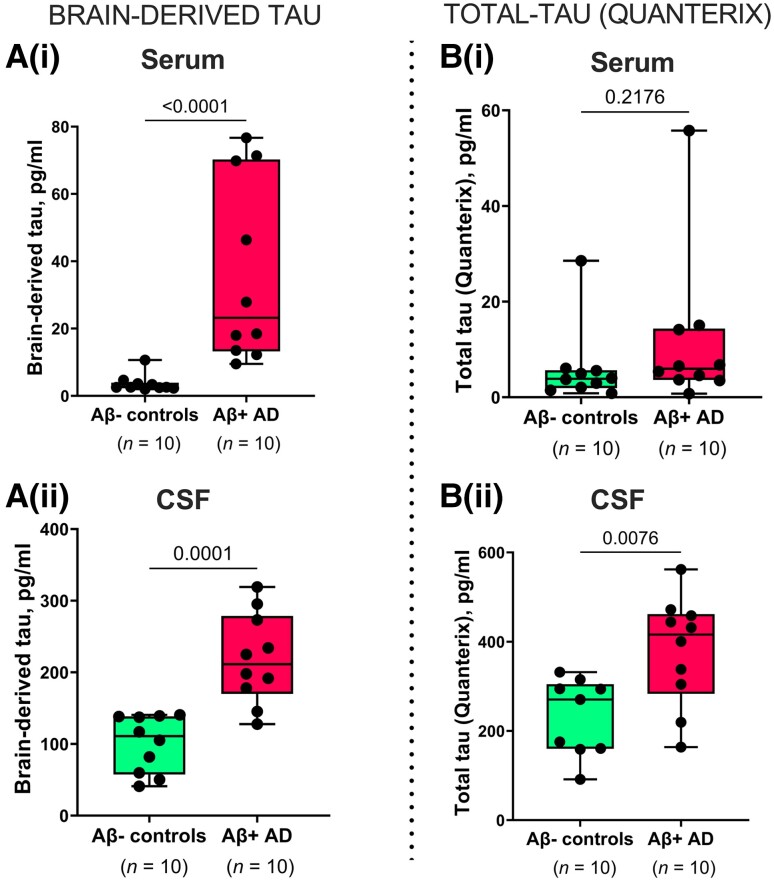
Concentrations and correlation of BD-tau in paired serum and CSF samples. [A(i and ii)] Concentrations of BD-tau in paired serum and CSF samples showing significant increases in Aβ+ Alzheimer’s disease and Aβ− control individuals classified according to their neurochemical CSF biomarker profiles. The corresponding levels of t-tau (Quanterix) in the same paired serum and CSF samples are shown in B(i) and B(ii), respectively. For B(ii), one sample in the Aβ− control group returned no measurable signal due to a technical instrument error. Excluding the CSF-serum pair of this sample from the analyses did not change the results. P-values indicate the results of Mann–Whitney tests. In each box plot, the horizontal bar on top of the coloured area shows the 75% percentile, the middle bar depicts the median and the lower bar shows the 25% percentile. Values that are above the 75% percentile and below the 25% percentile are shown outside the coloured areas. Note that there are differences in the absolute concentrations of BD-tau and t-tau in both serum and CSF, which can be explained by the use of different assay designs, analytical technologies, calibrators, and standard curves for each biomarker. This means that the values are a reflection of several factors, including assay sensitivity, and that absolute concentrations are not directly comparable in numerical sense.
Erratum for
-
Brain-derived tau: a novel blood-based biomarker for Alzheimer's disease-type neurodegeneration.Brain. 2023 Mar 1;146(3):1152-1165. doi: 10.1093/brain/awac407. Brain. 2023. PMID: 36572122 Free PMC article.
Publication types
LinkOut - more resources
Full Text Sources
Other Literature Sources
