. 2023 Aug;12(16):16716-16733.
doi: 10.1002/cam4.6294. Epub 2023 Jun 27.

Prognostic and immune infiltration significance of ARID1A in TCGA molecular subtypes of gastric adenocarcinoma

Affiliations

Prognostic and immune infiltration significance of ARID1A in TCGA molecular subtypes of gastric adenocarcinoma

Zhenkun Zhang et al. Cancer Med. 2023 Aug.

Abstract

Background: AT-rich interaction domain 1A (ARID1A) is an essential subunit of the switch/sucrose non-fermentable chromatin remodeling complex and is considered to be a tumor suppressor. The Cancer Genome Atlas (TCGA) molecular classification has deepened our understanding of gastric cancer at the molecular level. This study explored the significance of ARID1A expression in TCGA subtypes of gastric adenocarcinoma.

Methods: We collected 1248 postoperative patients with gastric adenocarcinoma, constructed tissue microarrays, performed immunohistochemistry for ARID1A, and obtained correlations between ARID1A and clinicopathological variables. We then carried out the prognostic analysis of ARID1A in TCGA subtypes. Finally, we screened patients by random sampling and propensity score matching method and performed multiplex immunofluorescence to explore the effects of ARID1A on CD4, CD8, and PD-L1 expression in TCGA subtypes.

Results: Seven variables independently associated with ARID1A were screened out: mismatch repair proteins, PD-L1, T stage, differentiation status, p53, E-cadherin, and EBER. The independent prognostic variables in the genomically stable (GS) subtype were N stage, M stage, T stage, chemotherapy, size, and ARID1A. PD-L1 expression was higher in the ARID1A negative group than in the ARID1A positive group in all TCGA subgroups. CD4 showed higher expression in the ARID1A negative group in most subtypes, while CD8 did not show the difference in most subtypes. When ARID1A was negative, PD-L1 expression was positively correlated with CD4/CD8 expression; while when ARID1A was positive, this correlation disappeared.

Conclusions: The negative expression of ARID1A occurred more frequently in the Epstein-Barr virus and microsatellite instability subtypes and was an independent adverse prognostic factor in the GS subtype. In the TCGA subtypes, ARID1A negative expression caused increased CD4 and PD-L1 expression, whereas CD8 expression appeared independent of ARID1A. The expression of CD4/CD8 induced by ARID1A negativity was accompanied by an increase in PD-L1 expression.

Keywords: ARID1A; TCGA subtype; gastric adenocarcinoma; immune infiltration; prognosis.


Conflict of interest statement

The authors declare no conflicts of interest.

Figures
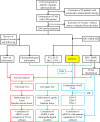
FIGURE 1
FIGURE 1
Study design and workflow of the present study. EBER‐ISH, EBV‐encoded RNA in situ hybridization; EBV, Epstein–Barr virus; Her‐2, human epidermal growth factor receptor 2; IHC, immunohistochemistry; mIF, multiplex immunofluorescence; MMR, mismatch repair; PD‐L1, programmed cell death ligand‐1; PSM, propensity score matching; TCGA, The Cancer Genome Atlas; TMA, tissue microarrays.
FIGURE 2
FIGURE 2
Representative immunohistochemistry images of important markers. (A) Diffuse strong expression of ARID1A; (B) reduced expression of ARID1A; (C) heterogeneous expression of ARID1A; (D) complete loss expression of ARID1A; (E) positive expression of MLH1; (F) negative expression of MLH1; (G) positive expression of E‐cadherin; (H) negative expression of E‐cadherin; (I) wild‐type expression of p53 (nuclear staining of variable intensity); (J) mutant‐type expression of p53 (diffuse and uniform strong nuclear staining); (K) mutant‐type expression of p53 (complete absence of nuclear staining); (L) positive expression of EBV. EBER, EBV‐encoded RNA; EBER‐ISH, EBV‐encoded RNA in situ hybridization.
FIGURE 3
FIGURE 3
(A) Flowchart of TCGA molecular classification based on IHC and EBER‐ISH. (B) Distribution of TCGA subtypes. (C) ARID1A expression in TCGA subtypes. CIN, chromosomal instability; EBV, Epstein–Barr virus; GS, genomically stable; MSI, microsatellite instability; ns, no significance. ***: p < 0.001.
FIGURE 4
FIGURE 4
Correlation analysis of ARID1A. (A) Variables screened by multivariate logistic regression analysis. (B) and (C) Variables filtered out by the minimalist model of LASSO regression. (D) Variables ranked by importance using random forest. dMMR, mismatch repair deficient; EBER, EBV‐encoded RNA; MMR: mismatch repair; PD‐L1, programmed cell death ligand‐1; pMMR, mismatch repair proficient.
FIGURE 5
FIGURE 5
Survival analysis plots. (A) Survival analysis by ARID1A expression in the entire cohort. (B) Survival analysis by TCGA subtypes in the entire cohort. (C)–(F) Survival analysis by ARID1A expression in TCGA subtypes. CIN, chromosomal instability; EBV, Epstein–Barr virus; GS, genomically stable; MSI, microsatellite instability. ***: p < 0.001.
FIGURE 6
FIGURE 6
Prognostic analysis in the GS subtype. (A) Independent prognostic variables screened by univariate and multivariate Cox regression analysis. (B) and (C) Variables filtered out by the minimalist model of LASSO regression. (D) Variables ranked by importance using random survival forest. Chemo, chemotherapy.
FIGURE 7
FIGURE 7
Heatmaps of CD4, CD8, and PDL1 expression and bar plots of TCGA subtypes distribution. (A) Heatmap of CD4, CD8, and PD‐L1 expression in tumor center. (B) Distribution of TCGA subtypes in ARID1A negative and positive groups in tumor center. (C) Heatmap of CD4, CD8, and PD‐L1 expression in invasive margin. (D) Distribution of TCGA subtypes in ARID1A negative and positive groups in invasive margin. CIN, chromosomal instability; EBV, Epstein–Barr virus; GS, genomically stable; IM, invasive margin; MSI, microsatellite instability; TC, tumor center; TCGA, The Cancer Genome Atlas. ***: p < 0.001.
FIGURE 8
FIGURE 8
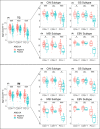
Impact of ARID1A status on the expression of CD4, CD8, and PD‐L1. (A) The entire mIF cohort in tumor center; (B)–(E) TCGA subtypes in tumor center; (F) the entire mIF cohort in invasive margin; (G)–(J) TCGA subtypes in invasive margin. CIN, chromosomal instability; EBV, Epstein–Barr virus; GS, genomically stable; IM, invasive margin; MSI, microsatellite instability; ns, no significance; TC, tumor center. *: p < 0.05; **: p < 0.01; ***: p < 0.001.
FIGURE 9
FIGURE 9
The correlation between PD‐L1 expression of IHC and immune infiltration. (A) and (D) The PD‐L1 expression in IHC was consistent with that in mIF; The expression of CD4/CD8 in the PD‐L1 positive group was significantly higher than that in PD‐L1 negative group for all cases. (B) and (E) When ARID1A was negative, the expression of CD4/CD8 in the PD‐L1 positive group was significantly higher than that in PD‐L1 negative group. (C) and (F) When ARID1A was positive, there was no difference in the expression of CD4/CD8 between PD‐L1 negative and PD‐L1 positive groups. IM, invasive margin; mIF, multiplex immunofluorescence; ns, no significance; TC, tumor center. *: p < 0.05; **: p < 0.01; ***: p < 0.001.
FIGURE 10
FIGURE 10
The correlation between PD‐L1 expression, CD4+, and CD8+ T cell infiltration in mIF. (A) and (D) PD‐L1, CD4, and CD8 were positively correlated in all cases; (B) and (E) PD‐L1, CD4, and CD8 were positively correlated in ARID1A negative cases; (C) and (F) CD4 and CD8 were positively correlated, while PD‐L1 was not associated with CD4 and CD8 in ARID1A positive cases. Corr, correlation coefficients; IM, invasive margin; ns, no significance; TC, tumor center; *: p < 0.05; **: p < 0.01; ***: p < 0.001.
FIGURE 11
FIGURE 11
Representative mIF images according to the expression status of ARID1A in the tumor center and invasive margin. IM ARID1A‐Neg, invasive margin and ARID1A negative; IM ARID1A‐Pos, invasive margin and ARID1A positive; TC ARID1A‐Neg, tumor center and AIRD1A negative; TC ARID1A‐Pos, tumor center and AIRD1A positive.

Similar articles

Cited by

References

    1. Sung H, Ferlay J, Siegel RL, et al. Global cancer statistics 2020: GLOBOCAN estimates of incidence and mortality worldwide for 36 cancers in 185 countries. CA Cancer J Clin. 2021;71(3):209‐249. doi:10.3322/caac.21660 - DOI - PubMed
    1. Cancer Genome Atlas Research Network . Comprehensive molecular characterization of gastric adenocarcinoma. Nature. 2014;513(7517):202‐209. doi:10.1038/nature13480 - DOI - PMC - PubMed
    1. Di Pinto F, Armentano R, Arborea G, Schena N, Donghia R, Valentini AM. Are immunohistochemical markers useful in phenotypic gastric cancer classification? Oncology. 2020;98(8):566‐574. doi:10.1159/000506077 - DOI - PubMed
    1. Birkman EM, Mansuri N, Kurki S, et al. Gastric cancer: immunohistochemical classification of molecular subtypes and their association with clinicopathological characteristics. Virchows Arch. 2018;472(3):369‐382. doi:10.1007/s00428-017-2240-x - DOI - PMC - PubMed
    1. Mittal P, Roberts CWM. The SWI/SNF complex in cancer–biology, biomarkers and therapy. Nat Rev Clin Oncol. 2020;17(7):435‐448. doi:10.1038/s41571-020-0357-3 - DOI - PMC - PubMed