. 2023 Apr 30;19(1):3-13.
doi: 10.46582/jsrm.1901002. eCollection 2023.

In Vivo Tumorigenicity of the 20q11.21 Amplicon in an Engraftment Model of hPSCs and Differentiated Liver Cells

Affiliations

In Vivo Tumorigenicity of the 20q11.21 Amplicon in an Engraftment Model of hPSCs and Differentiated Liver Cells

Chris S Pridgeon et al. J Stem Cells Regen Med. .

Abstract

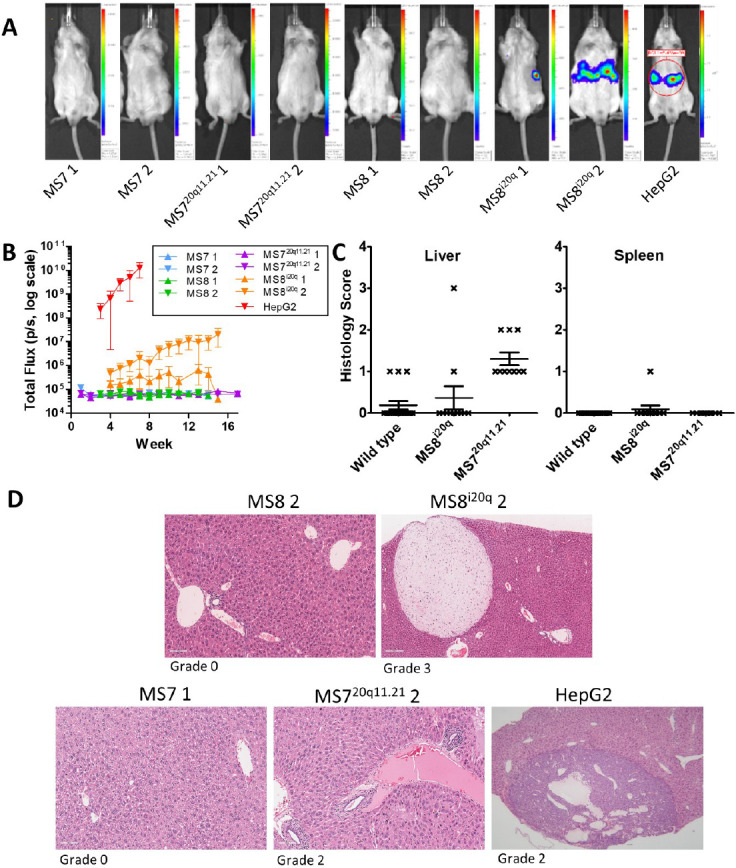
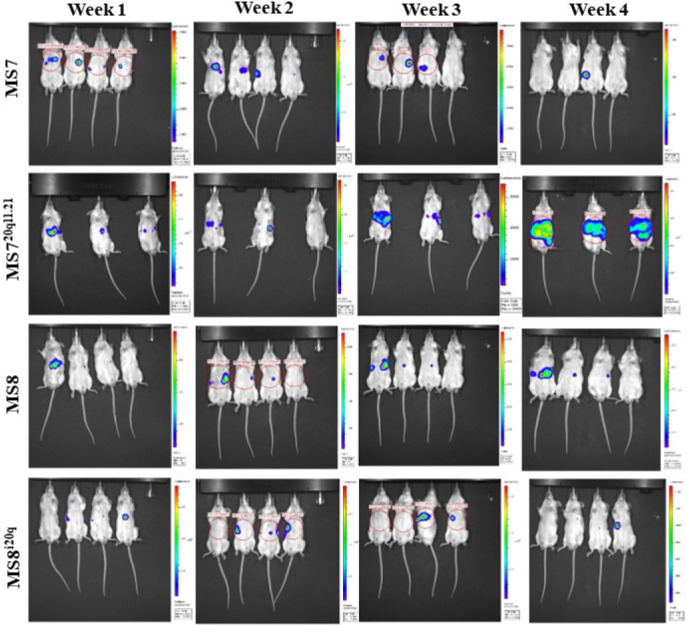
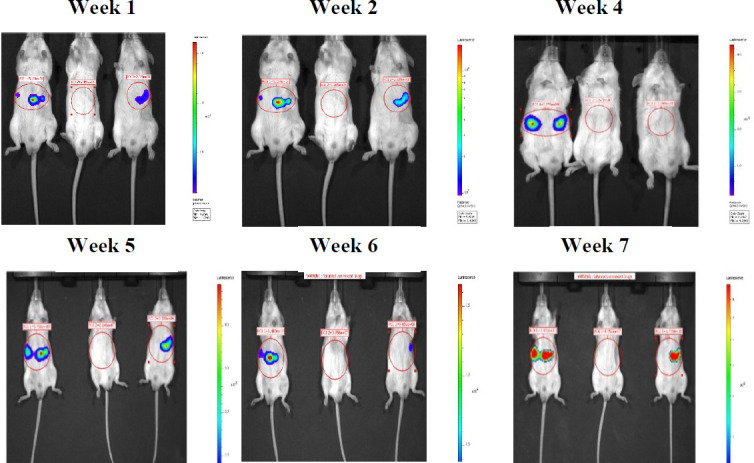
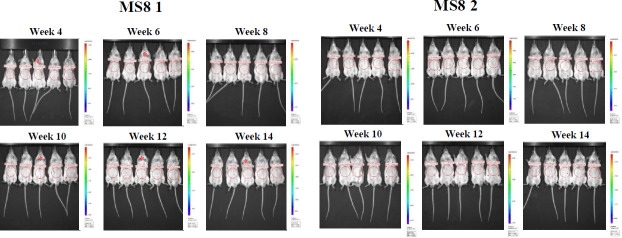
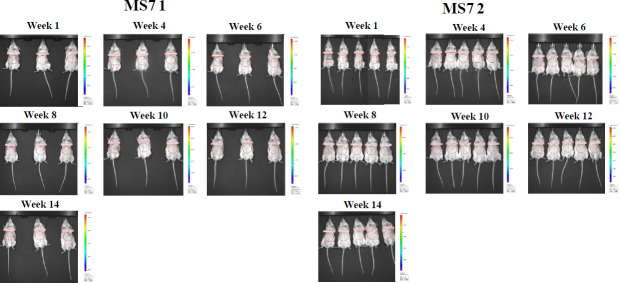
Human pluripotent stem cells (hPSCs) are a promising source of somatic cells for clinical applications and disease modelling. However, during culture they accumulate genetic aberrations such as amplification of 20q11.21 which occurs in approximately 20% of extensively cultured hPSC lines and confers a BCL2L1-mediated survival advantage. During the production of the large number of cells required for transplantation and therapy these aberrations may become unavoidable which has important safety implications for therapies and may also impact upon disease modelling. Presently, these risks are poorly understood; whilst it is apparent that large-scale genetic aberrations can pose an oncogenic risk, the risks associated with smaller, more insidious changes have not been fully explored. In this report, the effects of engraftment of human embryonic stem cells (hESCs) and hESC-derived hepatocyte-like cells (HLCs) with and without amplification of the 20q11.21 minimal amplicon and isochromosome 20q (i20q) in SCID-beige mice are presented. The cells were tracked in vivo using a luminescent reporter over a period of approximately four months. Intrasplenic injection of hESCs showed greater engraftment potential and the formation of more severely disruptive lesions in the liver and spleen of animals injected with cells containing 20q11.21 compared with i20q and wild type. HLCs with 20q11.21 engrafted more successfully and formed more severely disruptive lesions than wild type cells or cells with i20q. These results reinforce the notion that karyotyping of therapeutic hPSC is required for transplant, and suggest that screening for known common aberrations is necessary. Further work to identify commonly arising genetic aberrations should be performed and routine screening for hPSCs intended for therapeutic use should be used.

Keywords: Amplicon 20q11.21; Stem cell; Tumorigenicity.


Conflict of interest statement

This work was funded by UK Regenerative Medicine PlatformThe authors declare no conflicts of interest.

Figures

Figure 1.
Figure 1.. Transfection of undifferentiated hESCs with a luciferase construct and identification of appropriate dosage of CCl4 for consistent induction of acute liver injury in SCID-beige mice. (A) pCAG Firefly Luciferase-2A-Puro map (B) Haematoxylin and eosin staining of the liver of SCID-beige mice 24 or 72 hours after a single dose of CCl4 (0.2 or 0.4 mL/kg) or olive oil. Both doses of CCl4 induced severe coagulative necrosis of the centrilobular hepatocytes with or without the presence of acute haemorrhages (black arrows). After 72 hours, both groups showed a decreased degree of damage and a narrowing of the area of coagulative necrosis around the central vein with a continuous rim of hyper-basophilic regenerating hepatocytes and an increased number of mitotically active hepatocytes within the intervening healthy parenchyma. Olive oil did not elicit appreciable morphological degeneration of the hepatic parenchyma. (C) Mean hepatocellular damage score according to Thoolen et al. [19]. n=4 per condition (D) ALT activation in SCID-beige mice 24 and 72 hours after injection with CCl4. Data are displayed as U/L and show the mean, error bars show standard deviation. Significance was assessed using a paired two-tailed t-test, asterisks denote significance (*** = p≤0.001).
Figure 2.
Figure 2.. Undifferentiated hESCs with 20q11.21 amplicon induce extensive immature teratoma and teratocarcinoma in the murine liver. SCID-beige mice were injected with 1×10⁶ of undifferentiated MS7N, MS720211.21, MS8N or MS8i20q into the spleen and sacrificed after 28 days. (A) In vivo and ex vivo (liver and spleen) bioluminescence imaging of representative mice from each group after 28 days. See Supplementary Figure 1 for data from all mice. (B) Bioluminescence over time in vivo grouped by cell line. Values are plotted as mean total flux, error bars show SEM. (C) Mean bioluminescence of different cell lines imaged in livers and spleens ex vivo. Values are plotted as mean total flux, error bars show SEM. Differences were assessed using a two-tailed unpaired student’s t-test, asterisks denote the p-value (* = p ≤ 0.05, *** = p ≤ 0.001). Where no asterisks are shown no statistically significant difference was observed. (D) Haematoxylin and eosin staining of a representative liver tissue after injection with undifferentiated hESCs. Black arrows indicate immature teratoma, white arrows denote carcinomatous features (E) Grading of liver and spleen tissue from animals with intrasplenic injection of undifferentiated cells and grading system used to score liver and spleen tissues. Scoring was performed by a veterinary histopathologist according to Thoolen et al.[19]. (F) Representative IHC staining of liver and spleen tissue for vimentin and pan-cytokeratin to confirm the presence of teratoma.
Figure 3.
Figure 3.. Differentiation protocol and differentiation efficiency in MasterShef ESCs. (A) Overview of the differentiation protocol used, adapted from published protocols[16,17]. The top bar represents the day of the differentiation procedure and the medium and supplements used are shown underneath. Full details of the differentiation protocol can be found in the methods section. (B) Differentiation efficiency towards hepatocyte-like cells shown by HNF4a-positivity using flow cytometry. Cells were stained for HNF4a as a marker of differentiation and DAPI was used as a nuclear stain. Differentiation proportion is shown in white for each line.
Figure 4.
Figure 4.. MasterShef Fluc HLCs sporadically luminesce in vivo and increase liver tissue histology scores (A) Representative luminescence images of SCID beige mice 6 weeks after intrasplenic injection with MS HLCs or HepG2 cells. Luminescence is displayed in the coloured overlay where warmer colours indicate higher luminescence intensity. (B) Luminescence over time for each MS HLC line or HepG2 cells. Values are plotted as mean total flux and error bars show SEM. (C) Mean histology scores for liver and spleen tissues separated by tissue and amplicon status. Tissues were scored by a veterinary histopathologist according to [19]. Horizontal black bars indicate the mean and SEM. Statistical analysis (Kruskal-Wallis rank sum test) showed no significant differences in histology score in liver (p= 0.06865) and spleen (p=1) based on amplicon 20q11.21 status (D) Haematoxylin and eosin staining of mouse liver after injection with MS HLCs. The line injected and the grade assigned to the imaged tissue is noted. Moving left to right, beginning with the top row, the images show 1) distended central veins in normal tissue, 2) large single nodular mass made of stellate mesenchymal cells suspended in a light eosinophilic matrix 3) normal tissue, mild central vein distension 4) moderate leukocyte infiltration in portal space and around biliary ducts and 5) a large neoplastic mass with scattered cyst-like areas (both acinuslike and distended vascular spaces). All images are 20× except for HepG2 which is 10×. Scale bars are 100 μm
Supplemental Figure 1.
Supplemental Figure 1.. Representative bioluminescence images of SCID beige mice intrasplenically injected with undifferentiated hESCs - Images show luminescence over time from side and front elevations. Red circles show regions of interest used to determine luminescence intensity, in this case showing radiance, though total flux was also recorded. Luminescence intensity is represented by the coloured overlays with warmer colour indicating greater intensity. Each scale bar applies only to the image to its immediate left. The order of animals is consistent between images.
Supplemental Figure 2.
Supplemental Figure 2.. A. High magnification histology - Haematoxylin and eosin staining of representative livers 4 weeks after injection with undifferentiated hESCs with different magnifications. B. Luminescence of undifferentiated MS lines in vitro. Values are photons/second (p/s) from a confluent well of a 24-well plate.
Supplemental Figure 3.
Supplemental Figure 3.. Representative bioluminescence images of SCID beige mice intrasplenically injected with HepG2_Fluc - Images show luminescence over time from side and front elevations. Red circles show regions of interest used to determine luminescence intensity, in this case showing radiance, though total flux was also recorded. Luminescence intensity is represented by the coloured overlays with warmer colour indicating greater intensity. Each scale bar applies only to the image to its immediate left. The order of animals is consistent between images.
Supplemental Figure 4.
Supplemental Figure 4.. Representative bioluminescence images of SCID beige mice intrasplenically injected with MS8l20q 1 (left) & 2 (right) hESC-HLCs Images show luminescence over time from side and front elevations. Red circles show regions of interest used to determine luminescence intensity, in this case showing radiance, though total flux was also recorded. Luminescence intensity is represented by the coloured overlays with warmer colour indicating greater intensity. Each scale bar applies only to the image to its immediate left. The order of animals is consistent between images, after week 6, at 4 weeks, animal 2 and 3 were mis-placed. Some animals were excluded due to thymic lymphoma discovered at the end of the experiment and are indicated with an asterisk (*)
Supplemental Figure 5.
Supplemental Figure 5.. Representative bioluminescence images of SCID beige mice intrasplenically injected with MS8 1 (left) & 2 (right) hESC-HLCs - Images show luminescence over time from side and front elevations. Red circles show regions of interest used to determine luminescence intensity, in this case showing radiance, though total flux was also recorded. Luminescence intensity is represented by the coloured overlays with warmer colour indicating greater intensity. Each scale bar applies only to the image to its immediate left. The order of animals is consistent between images. Some animals were excluded due to thymic lymphoma discovered at the end of the experiment and are indicated with an asterisk (*).
Supplemental Figure 6.
Supplemental Figure 6.. Representative bioluminescence images of SCID beige mice intrasplenically injected with MS720qIL211 (left) & 2 (right) hESC-HLCs - Images show luminescence over time from front elevations. Red circles show regions of interest used to determine luminescence intensity, in this case showing radiance, though total flux was also recorded. Luminescence intensity is represented by the coloured overlays with warmer colour indicating greater intensity. Each scale bar applies only to the image to its immediate left. The order of animals is consistent between images. In MS720q11.211 after week 4, one animal was sacrificed due to poor health and the remaining animal is that on the furthest right of the remaining images. Some animals were excluded due to thymic lymphoma discovered at the end of the experiment and are indicated with an asterisk (*).
Supplemental Figure 7.
Supplemental Figure 7.. Representative bioluminescence images of SCID beige mice intrasplenically injected with MS7 1 (left) & 2 (right) hESC-HLCs - Images show luminescence over time from front elevations. Red circles show regions of interest used to determine luminescence intensity, in this case showing radiance, though total flux was also recorded. Luminescence intensity is represented by the coloured overlays with warmer colour indicating greater intensity. Each scale bar applies only to the image to its immediate left. The order of animals is consistent between images. Some animals were excluded due to thymic lymphoma discovered at the end of the experiment and are either not shown or indicated with an asterisk In MS7 2, after week 1, the animals in the second row are the two animals to the furthest right in subsequent images.

References

    1. Harrison NJ, Baker D, Andrews PW. Advances in Stem Cell Research. Stem Cell Biology and Regenerative Medicine. Humana Press; Totowa, NJ: 2012. The Significance of Culture Adaptation of Embryonic Stem Cells for Regenerative Medicine. pp. 17–27. - DOI
    1. Ben-David U, Arad G, Weissbein U, Mandefro B, Maimon A, Golan-Lev T, Narwani K, Clark AT, Andrews PW, Benvenisty N, Carlos Biancotti J. Aneuploidy induces profound changes in gene expression, proliferation and tumorigenicity of human pluripotent stem cells. Nat Commun. 2014;5:4825. - PubMed
    1. International Stem Cell Initiative. Amps K, Andrews PW et al. Screening ethnically diverse human embryonic stem cells identifies a chromosome 20 minimal amplicon conferring growth advantage. Nat Biotechnol. 2011;29((12)):1132–44. - PMC - PubMed
    1. Spits C, Mateizel I, Geens M, Mertzanidou A, Staessen C, Vandeskelde Y, Van der Elst J, Liebaers I, Sermon K. Recurrent chromosomal abnormalities in human embryonic stem cells. Nat Biotechnol. 2008;26((12)):1361–3. - PubMed
    1. Maitra A, Arking DE, Shivapurkar N, Ikeda M, Stastny V, Kassauei K, Sui G, Cutler DJ, Liu Y, Brimble SN, Noaksson K, Hyllner J, Schulz TC, Zeng X, Freed WJ, Crook J, Abraham S, Colman A, Sartipy P, Matsui S, Carpenter M, Gazdar AF, Rao M, Chakravarti A. Genomic alterations in cultured human embryonic stem cells. Nat Genet. 2005;37((10)):1099–103. - PubMed

LinkOut - more resources