. 2021 Sep 1;1(1):61-74.
doi: 10.1002/EXP.20210004. eCollection 2021 Aug.

Receptor-targeting nanomaterials alleviate binge drinking-induced neurodegeneration as artificial neurotrophins

Affiliations

Receptor-targeting nanomaterials alleviate binge drinking-induced neurodegeneration as artificial neurotrophins

Jingyu Yang et al. Exploration (Beijing). .

Abstract

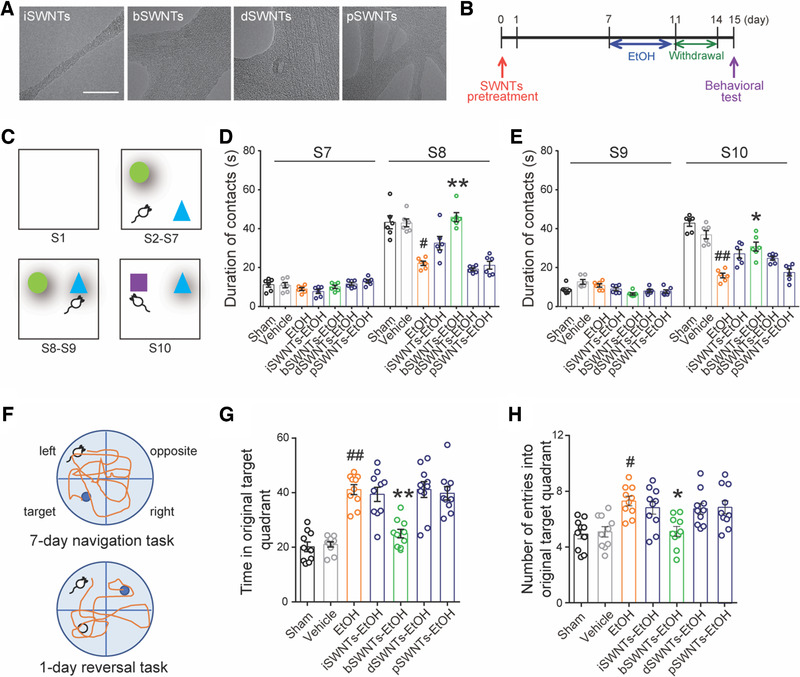
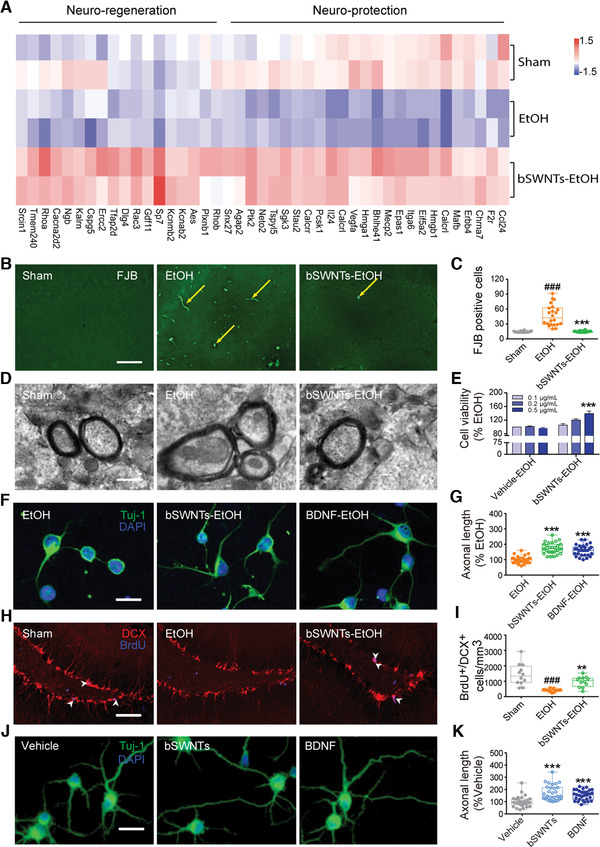
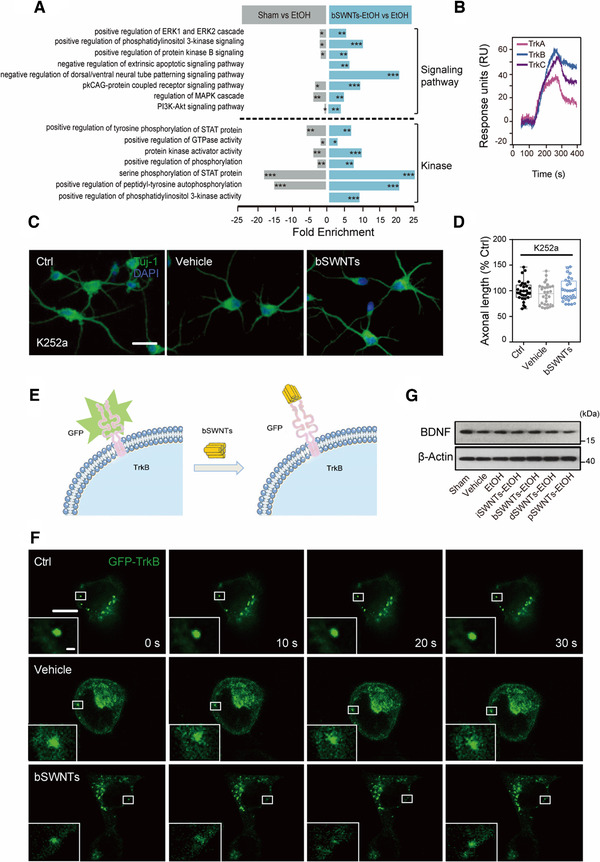
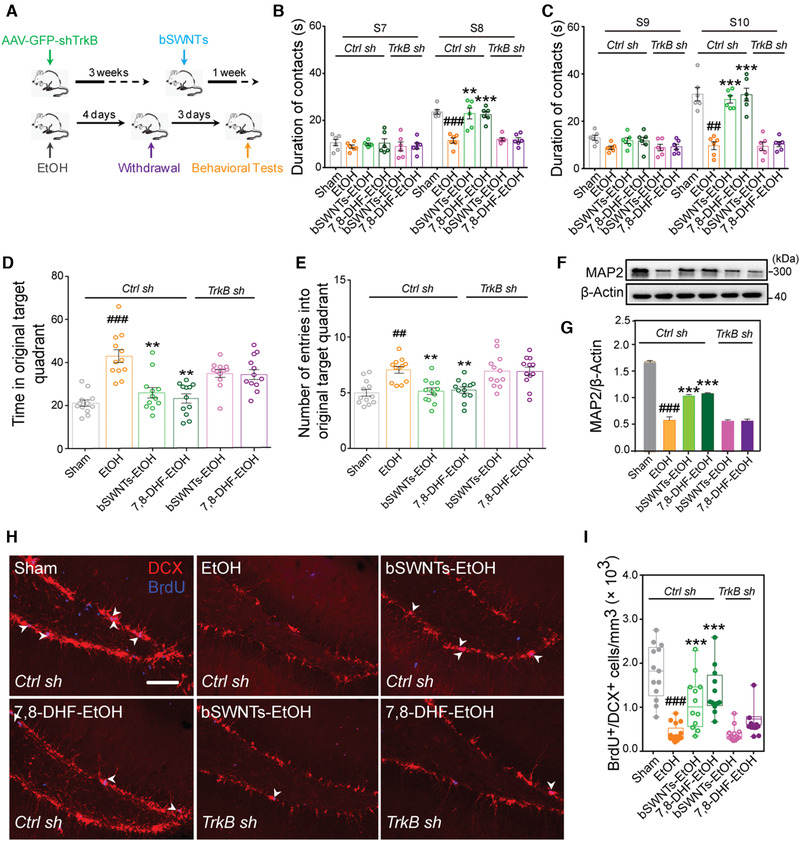
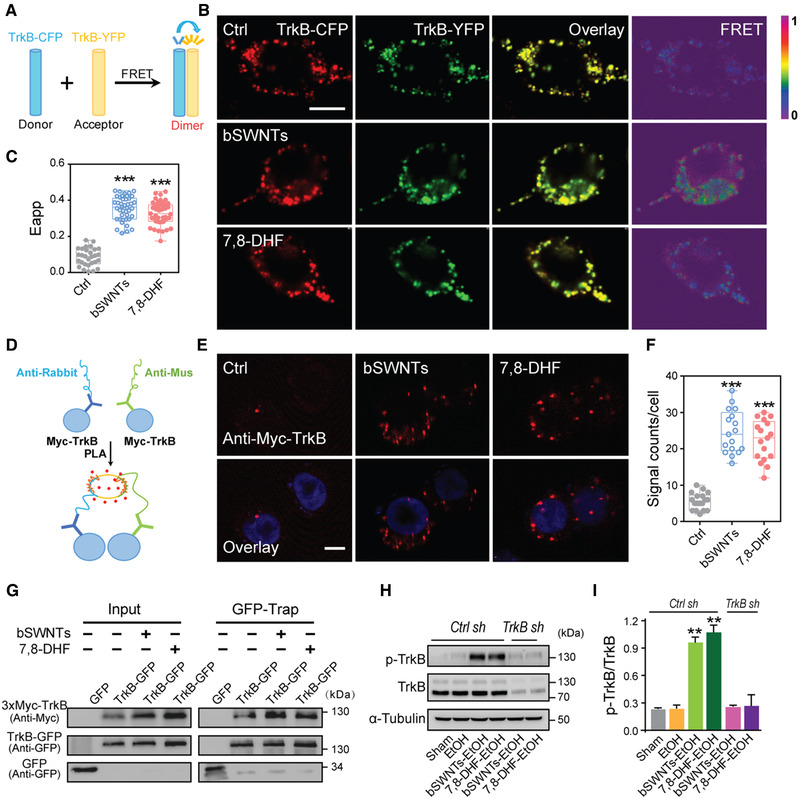
The distinguished properties of nanomaterials promote us to explore whether their intrinsic activities would be beneficial to disease treatment. Furthermore, understanding the molecular mechanism is thereby crucial for biomedical applications. Here, we investigate the therapeutic effects of single-walled carbon nanotubes (SWNTs) in a rat model of binge alcohol-induced neurodegeneration. With selection from four types of SWNT structures, bundled SWNTs (bSWNTs) facilitated the recovery of learning and memory via enhancing neuroprotection and neuroregeneration. We screened the potential target for bSWNTs, and found that bSWNTs have the abilities to directly interact with neurotrophic receptors, especially tropomyosin-related kinase B (TrkB). Moreover, similar to the actions of endogenous neurotrophins, bSWNTs could trigger the dimerization and phosphorylation of TrkB, while these conformational changes resulted in activating their downstream signals involved in neuroprotection and neuroregeneration. With relatively clear mechanisms, these "artificial neurotrophins" provide a proof-of-concept example as an efficiently therapeutic strategy for the treatment of neurodegenerative diseases.

Keywords: artificial neurotrophins; binge drinking; carbon nanotubes.


Conflict of interest statement

The authors declare that they have no conflict of interest.

Figures

FIGURE 1
FIGURE 1
bSWNTs promote the recovery of learning and memory function in rats with EtOH‐induced neurodegeneration. (A) Typical HR‐TEM micrographs of the four SWNTs. Scale bar; 10 nm. (B) Experimental procedure for administration of 4 different types of SWNT (i.c.v. 40 ng/rat). One week before binge ethanol exposure, rats were treated with either vehicle or different SWNTs. Some rats were sacrificed after 4‐day ethanol exposure for subsequent protein analysis, while others underwent behavioral tests after 3 days of withdrawal. (C) Behavioral training schedule for the object recognition tests. (D,E) Representative results from the novel location recognition (D) and novel object recognition (E) tests, indicating the effects of SWNTs on learning and memory. # p < 0.05, ## p < 0.01 versus the vehicle group; *p < 0.05, **p < 0.01 versus EtOH group, one‐way ANOVA; n = 8. (F) A schematic representation of the Morris water maze protocol. Mice were trained for 7 days in a navigation task to locate a hidden platform in the original target quadrant. The hidden platform was then moved to the opposite quadrant during the reversal task. (G,H) The time spent in the original target quadrant (G) and the number of entries into the original target quadrant (H) in the Morris water maze reversal task. Administration of bSWNTs facilitated the recovery of spatial memory deficits induced by binge ethanol. Data are presented as means ± SEM. # p < 0.05, ## p < 0.01 versus the vehicle group; *p < 0.05, **p < 0.01 versus EtOH group, one‐way ANOVA; n = 8
FIGURE 2
FIGURE 2
bSWNTs protect neurons from EtOH‐induced death, and stimulate neuronal growth and regeneration. (A) Heatmaps of gene‐expression data from microarray analysis. Global gene expression changes were measured by high‐throughput sequencing analysis, and genes associated with neuro‐protection and neuro‐regeneration were calculated in sham, EtOH and bSWNT‐administrated groups. The data shown represent two independent experiments, and each sample contained hippocampus from two rats. (B) Photomicrographs of the hippocampal region showing degenerating neurons, which are stained by FJB as bright green puncta (yellow arrows). Fewer FJB‐positive cells are seen in the bSWNT administration group than in the EtOH group. Scale bar, 100 μm. (C) Quantitative analysis of FJB+ cells in the hippocampus. Data are presented as the mean number of FJB‐positive cells/mm2 ± SEM. ### p < 0.001 versus the sham group; ***p < 0.001 versus the EtOH group; n = 16 sham, n = 22 EtOH, n = 22 bSWNTs‐EtOH from 4 rats. (D) TEM showing the ultra‐structure of EtOH‐induced changes in neuronal myelin, which were reversed by bSWNTs. Scale bar, 20 nm. (E) Cell viability assay by CCK‐8 showing that bSWNTs protected neurons from EtOH‐induced primary neuron death. Data are presented as means ± SEM. ***p < 0.001 versus the EtOH group. (F) Confocal images of EtOH‐damaged neurons treated with bSWNTs, and BDNF as the positive control. Scale bar, 20 μm. (G) Bar graphs showing quantifications of axonal length in panel (F) by Image J. Data are presented as means ± SEM; ***p < 0.001 versus the EtOH group; n = 30 from 5 independent repeats. (H,I) Confocal images and quantification of DCX/BrdU immunostaining in hippocampus. White arrowheads indicate colocalization of DCX/BrdU staining. Scale bar, 50 μm. Administration of bSWNTs caused a significant increase in the number of DCX+/BrdU+ cells. Data are presented as means ± SEM. ### p < 0.001 versus the vehicle group; **p < 0.01 versus the EtOH group. n = 15 EtOH group, others n = 12 from 3 rats per group. (J) The morphology of cortical primary neurons stained by Tuj‐1 and DAPI. (K) Quantitative analysis of the axonal length, showing the significant increase caused by treatment with bSWNTs. BDNF treatment was a positive control. Data are presented as means ± SEM. ***p < 0.001 versus the vehicle group. n = 30 cells from 5 independent cultures
FIGURE 3
FIGURE 3
TrkB is a potential target of bSWNTs for neuronal protection and regeneration. (A) Selective GO function enrichment analysis significantly upregulated in bSWNTs‐treated group. Functional terms showing bSWNTs mainly affected MAPK and Akt/PI3K signaling pathways, and kinase activity/phosphorylation were screened out in EtOH versus Sham, and bSWNTs‐EtOH versus EtOH groups. The fold enrichment is expressed from −25 to 25. *False discovery rate (FDR)‐adjusted p ≤ 0.05, **FDR‐adjusted p ≤ 0.01, ***FDR‐adjusted p ≤ 0.001. (B) SPR assay demonstrating the interaction between bSWNTs and full‐length TrkA, TrkB, or TrkC. (C) Confocal images of the enhancement of axonal growth by bSWNTs, which is inhibited by the TrkB antagonist K252a. Scale bars, 20 μm. (D) Quantitative data from (C). Bar graphs show quantifications of axonal length by Image J. Data are presented as means ± SEM. n = 30 cells from 5 independent cultures. (E) Schematic diagram of GFP‐TrkB binding to bSWNT. (F) Continuous confocal imaging recording quenched fluorescence of GFP‐TrkB when directly binding with bSWNTs, suggesting bSWNTs dynamically recruit to GFP‐TrkB. Scale bar, 20 μm. (G) The expression of BDNF in hippocampus was detected by immunoblotting. No significant changes were observed after different types of SWNT treatment
FIGURE 4
FIGURE 4
bSWNTs improve neurological function by TrkB. (A) Graphic illustration showing the timeline of TrkB knockdown, administration of bSWNTs, EtOH treatment and withdrawal, and behavioral tests. (B,C) Results from the novel location recognition test (B) and the novel object recognition test (C) to determine the effects of SWNTs and the specific TrkB agonist 7, 8‐DHF on learning and memory improvement in control, and TrkB knockdown rats. Data are presented as means ± SEM. ## p < 0.01, ### p < 0.001 versus the sham group; **p < 0.01, ***p < 0.001 versus EtOH group, one‐way ANOVA; n = 6. (D) Time in the original target quadrant in the Morris Water maze behavioral test, and (E) number of entries into the original target quadrant in the Morris water maze test, indicating that bSWNTs lost their ability to enhance memory recovery after TrkB knockdown. Data are presented as means ± SEM. ## p < 0.01, ### p < 0.001 versus the sham group; **p < 0.01 versus EtOH group, one‐way ANOVA; n = 8. (F) MAP2 expression detected by western blotting after TrkB knockdown. (G) Quantification of MAP2 expression in hippocampus. Data are presented as means ± SEM; ### p < 0.001 versus the sham group; ***p < 0.001 versus the EtOH group; n = 4 from 3 rats. (H) Double staining of DCX+/BrdU+ cells in hippocampus. White arrowheads indicate colocalization of DCX/BrdU staining. Scale bar, 50 μm. (I) Quantitative results from (H) indicating that TrkB knockdown also blocks the neural regeneration induced by administration of bSWNTs or 7,8‐DHF. Data are presented as means ± SEM. ### p < 0.001 versus the sham group; ***p < 0.001 versus EtOH group; n = 13 sham, n = 17 EtOH, n = 12 bSWNTs‐EtOH, n = 13 7,8‐DHF‐EtOH under Ctrl sh; n = 12 bSWNTs‐EtOH, n = 12 7,8‐DHF‐EtOH under shTrkB knockdown, from 5 rats per group
FIGURE 5
FIGURE 5
Mechanisms of TrkB activation by bSWNTs. (A) Illustration of the FRET experiment. (B) FRET signal was measured between TrkB‐CFP and TrkB‐YFP in HEK293 cells. Scale bar, 10 μm. (C) Quantification of the apparent FRET efficiency (Eapp) from panel (B). Data are presented as means ± SEM. ***p < 0.001 versus Ctrl group. Three random regions were selected in each counted cell. n = 29 Ctrl, n = 42 bSWNTs, n = 45 7,8‐DHF. (D) Schematic showing the Duo‐link PLA to detect the TrkB‐TrkB interaction. (E) Red spots representing individual TrkB dimerization events were visualized by the PLA. Scale bar, 10 μm. (F) Quantification of red spots in the PLA assay presented in the panel (E). Data are presented as means ± SEM. ***p < 0.001 versus Ctrl group; n = 18 Ctrl, n = 17 bSWNTs, n = 17 7,8‐DHF. (G) In a GFP‐Trap assay, Myc‐TrkB was precipitated by TrkB‐GFP from HEK293 cells treated with bSWNTs or 7,8‐DHF, which indicates that these treatments promote TrkB dimerization. (H) Western blots illustrating that TrkB knockdown suppressed the bSWNT‐ or 7,8‐DHF‐stimulated expression and phosphorylation of TrkB. (I) The ratio of phospho‐TrkB and total TrkB was increased after administration of bSWNTs or 7,8‐DHF, but was dramatically decreased by shTrkB. Data are presented as means ± SEM. **p < 0.01 versus EtOH group; n = 4 rats per group

References

    1. Waszkiewicz N., Galinska‐Skok B., Nestsiarovich A., Kulak‐Bejda A., Wilczynska K., Simonienko K., Kwiatkowski M., Konarzewska B., Dis. Markers 2018, 2018, 5623683. - PMC - PubMed
    1. Zeigler D. W., Wang C. C., Yoast R. A., Dickinson B. D., McCaffree M. A., Robinowitz C. B., Sterling M. L., Prev. Med. 2005, 40, 23. - PubMed
    1. Darcq E., Morisot N., Phamluong K., Warnault V., Jeanblanc J., Longo F. M., Massa S. M., Ron D., J. Neurosci. 2016, 36, 10116. - PMC - PubMed
    1. Haun H. L., Griffin W. C., Lopez M. F., Solomon M. G., Mulholland P. J., Woodward J. J., McGinty J. F., Ron D., Becker H. C., Neuropharmacology 2018, 140, 35. - PMC - PubMed
    1. Allen S. J., Watson J. J., Shoemark D. K., Barua N. U., Patel N. K., Pharmacol. Ther. 2013, 138, 155. - PubMed

LinkOut - more resources