

Stock market optimization amidst the COVID-19 pandemic: Technical analysis, K-means algorithm, and mean-variance model (TAKMV) approach
- PMID: 37366512
- PMCID: PMC10287180
- DOI: 10.1016/j.heliyon.2023.e17577
Stock market optimization amidst the COVID-19 pandemic: Technical analysis, K-means algorithm, and mean-variance model (TAKMV) approach
Erratum in
-
Corrigendum to "Stock market optimization amidst the COVID-19 pandemic: Technical analysis, K-means algorithm, and mean-variance model (TAKMV) approach" [9(7) (July 2023) e17577].Heliyon. 2023 Aug 3;9(8):e18640. doi: 10.1016/j.heliyon.2023.e18640. eCollection 2023 Aug. Heliyon. 2023. PMID: 37701395 Free PMC article.
Abstract
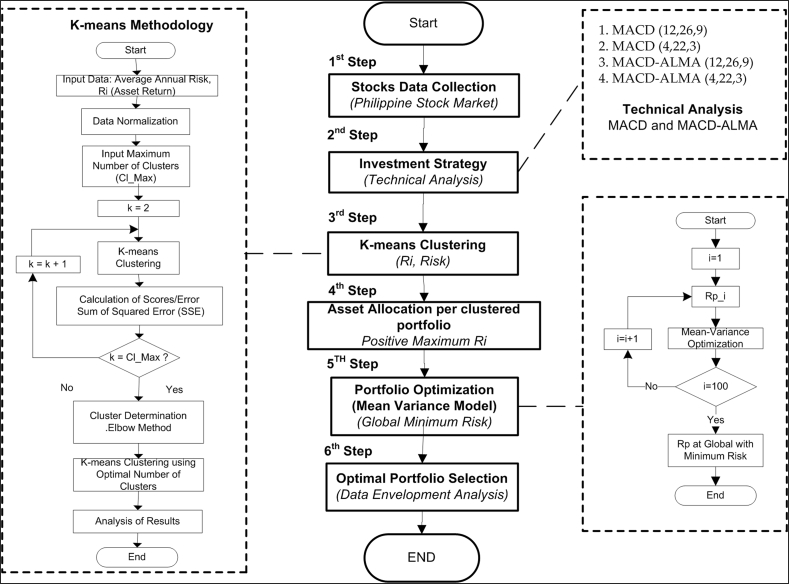
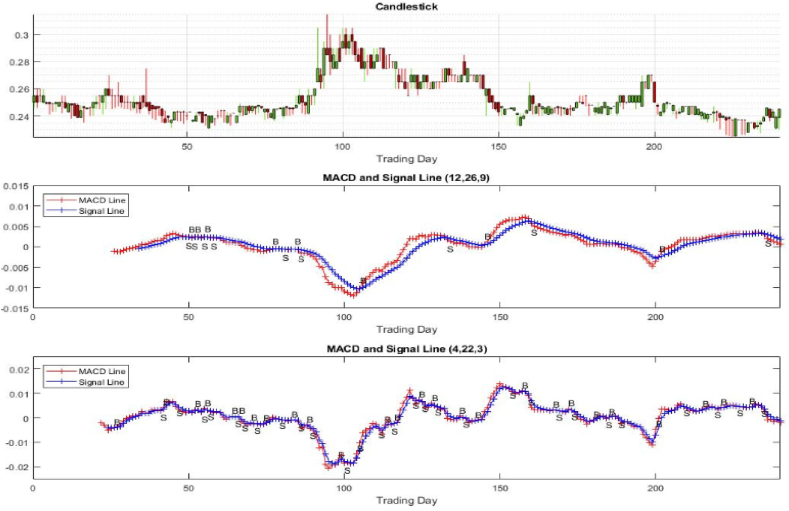
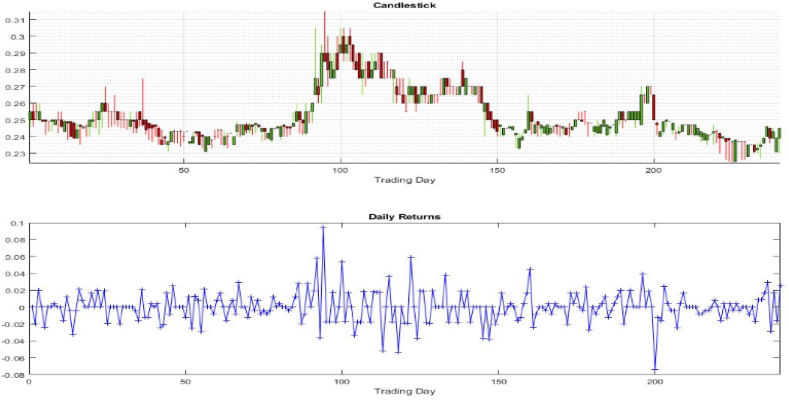
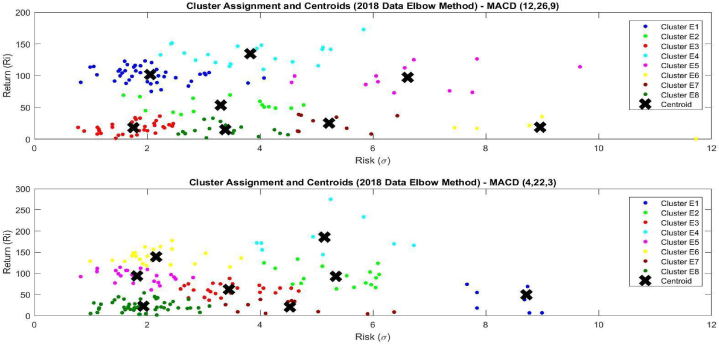
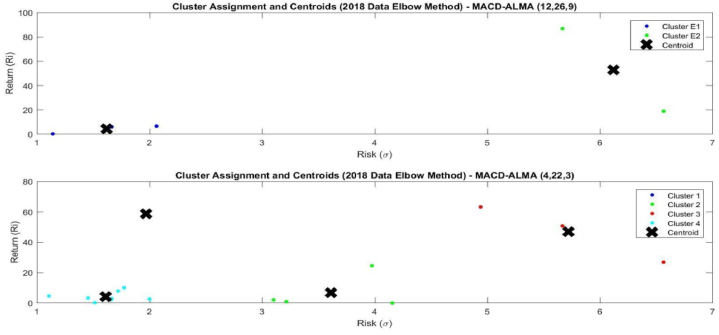
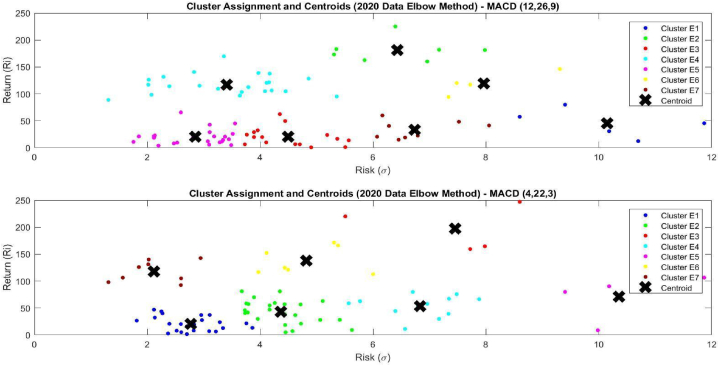
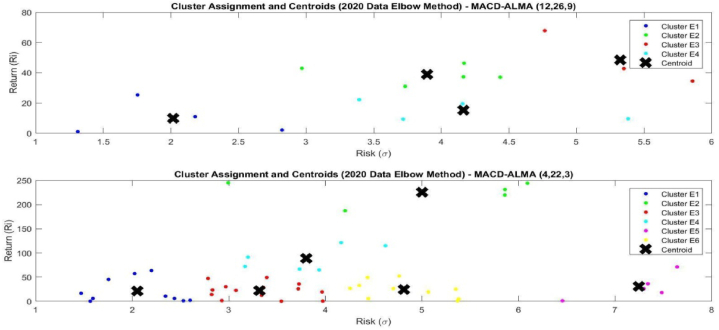
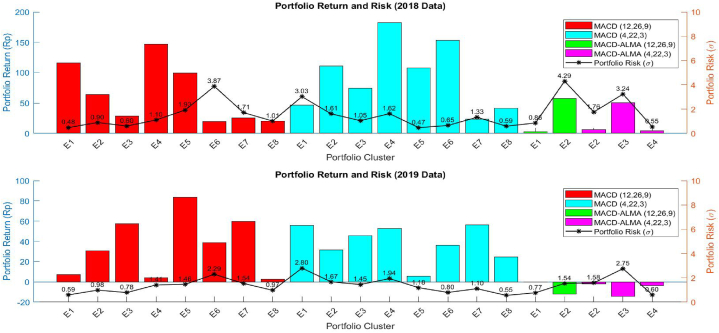
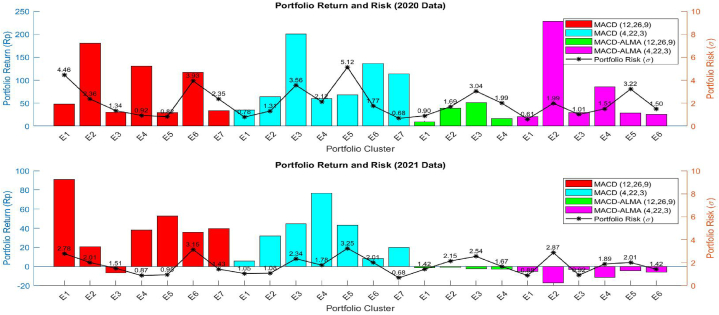
The Philippine stock market, just like most of its neighbors in the region, was seriously impacted by the global pandemic COVID-19. Investors remain hopeful while continuing to seek great ones in the damaged market. This paper developed a methodology for portfolio selection and optimization with the use of technical analysis, machine learning techniques, and portfolio optimization model. The combined methods of technical analysis, K-means clustering algorithm, and mean-variance portfolio optimization model will result in the development of the proposed TAKMV method. The study aims to integrate these three important analyses to identify portfolio investments. This paper uses the average annual risk and annual rate of return data for the years 2018 and 2020 to form the clusters and assessed the stocks that correspond to the investor's technical strategy such as Moving Average Convergence/Divergence (MACD) and Hybrid MACD with Arnaud Legoux Moving Average (ALMA). This paper solved the risk minimization problem on selected shares of the companies, based on the mean-variance portfolio optimization model. There are 230 and 239 companies for 2018 and 2020, respectively, listed in Philippine Stock Market, and all simulations were performed in MATLAB environment platform. Results showed that MACD strategy dominates the MACD-ALMA strategy in terms of the number of assets with a positive annual rate of return. The MACD works efficiently in the pre-COVID-19 condition while MACD-ALMA works efficiently during-COVID-19 condition, regardless of the number of assets with a positive annual rate of return. The results also show that the maximum expected portfolio return (RP) can be achieved using the MACD and MACD-ALMA in the pre-and during-COVID-19 conditions, respectively. The MACD-ALMA shows an advantage during high-risk market conditions and can also provide maximum RP. The performance of the TAKMV method was validated by applying its results and comparing it to the next year's historical price. The 2018 results were compared to 2019 data and the 2020 results were compared to 2021 data. For consistency, the comparison was applied to the same company per portfolio. Simulation results show that the MACD strategy is more effective compared to MACD-ALMA.
Keywords: COVID-19; Machine learning; Optimization; Stock market; Technical analysis.
© 2023 The Authors.
Conflict of interest statement
The authors declare that they have no known competing financial interests or personal relationships that could have appeared to influence the work reported in this paper.
Figures


References
-
- Elsayed A., Abdelrhim M. 2020. The Effect of COVID-19 Spread on Egyptian Stock Market Sectors. Available at: SSRN 3608734.
-
- Kartal M.T., Depren S.K., Depren Ö. How main stock exchange indices react to covid-19 pandemic: daily evidence from east asian countries. Global Econ. Rev. 2021;50(1):54–71. doi: 10.1080/1226508X.2020.1869055. - DOI
-
- Xu D. Canadian stock market volatility under COVID-19. Int. Rev. Econ. Finance. 2022;77:159–169.
LinkOut - more resources
Full Text Sources
