. 2023 Aug 1;325(2):L174-L189.
doi: 10.1152/ajplung.00018.2023. Epub 2023 Jun 27.

Gamma secretase activating protein promotes end-organ dysfunction after bacterial pneumonia

Affiliations

Gamma secretase activating protein promotes end-organ dysfunction after bacterial pneumonia

Meredith S Gwin et al. Am J Physiol Lung Cell Mol Physiol. .

Abstract

Pneumonia elicits the production of cytotoxic beta amyloid (Aβ) that contributes to end-organ dysfunction, yet the mechanism(s) linking infection to activation of the amyloidogenic pathway that produces cytotoxic Aβ is unknown. Here, we tested the hypothesis that gamma-secretase activating protein (GSAP), which contributes to the amyloidogenic pathway in the brain, promotes end-organ dysfunction following bacterial pneumonia. First-in-kind Gsap knockout rats were generated. Wild-type and knockout rats possessed similar body weights, organ weights, circulating blood cell counts, arterial blood gases, and cardiac indices at baseline. Intratracheal Pseudomonas aeruginosa infection caused acute lung injury and a hyperdynamic circulatory state. Whereas infection led to arterial hypoxemia in wild-type rats, the alveolar-capillary barrier integrity was preserved in Gsap knockout rats. Infection potentiated myocardial infarction following ischemia-reperfusion injury, and this potentiation was abolished in knockout rats. In the hippocampus, GSAP contributed to both pre- and postsynaptic neurotransmission, increasing the presynaptic action potential recruitment, decreasing neurotransmitter release probability, decreasing the postsynaptic response, and preventing postsynaptic hyperexcitability, resulting in greater early long-term potentiation but reduced late long-term potentiation. Infection abolished early and late long-term potentiation in wild-type rats, whereas the late long-term potentiation was partially preserved in Gsap knockout rats. Furthermore, hippocampi from knockout rats, and both the wild-type and knockout rats following infection, exhibited a GSAP-dependent increase in neurotransmitter release probability and postsynaptic hyperexcitability. These results elucidate an unappreciated role for GSAP in innate immunity and highlight the contribution of GSAP to end-organ dysfunction during infection.NEW & NOTEWORTHY Pneumonia is a common cause of end-organ dysfunction, both during and in the aftermath of infection. In particular, pneumonia is a common cause of lung injury, increased risk of myocardial infarction, and neurocognitive dysfunction, although the mechanisms responsible for such increased risk are unknown. Here, we reveal that gamma-secretase activating protein, which contributes to the amyloidogenic pathway, is important for end-organ dysfunction following infection.

Keywords: acute lung injury; beta amyloid; long-term potentiation; myocardial infarction; pneumonia.


Conflict of interest statement

No conflicts of interest, financial or otherwise, are declared by the authors.

Figures

None
Graphical abstract
Figure 1.
Figure 1.
Wild-type and Gsap knockout rats exhibit similar infection-induced hemodynamic responses. A: schematic showing the 5 bp deletion in exon 16 of the Gsap gene produced using CRISPR/Cas9 technology. B: wild-type (WT; n = 18) and knockout (KO; n = 31) rats were infected with ExoY+ and the percentage of animals that survived up to the point of the terminal experiment at 48 h postinfection was measured. Eighty-three percent of wild-type rats survived 24 h postinfection, whereas 50% of the rats survived to 48 h postinfection. One hundred percent of the knockout rats survived 24 h postinfection, whereas 65% of the rats survived to 48 h postinfection (P = ns between WT and KO rats). C: wild-type (n = 13) and knockout (n = 14) rats were weighed before infection and 48 h postinfection. Rats lost ∼25 g body weight 48 h postinfection. There was no significant difference in weight loss between the two groups (two-tailed Welch’s t test, P = ns). D: Aβx-40 (Aβ40) was measured in rats at baseline and 48 h following infection. There was no difference in the baseline circulating Aβ40 concentrations (post hoc P = ns; main effect for genotype, P = ns, and for infection, P = ns; n = 4–6). Aβx-42 (Aβ42) was measured in rats at baseline and 48 h following infection. There was no difference in the baseline circulating Aβ42 concentrations (main effect for genotype, P = ns, and for infection, P = ns; post hoc, P = ns), yet the Aβ42 concentration was increased in wild type but not in the knockout rats 48 h postinfection (main effect for infection, P = 0.0337; post hoc, P = 0.0069; n = 4–6). The Aβ42/40 ratio was not different among the animal genotypes, but it was increased in both wild-type (P < 0.0001) and knockout (P < 0.0001) rats following infection (main effect for genotype, P = ns, and for infection, P ≤ 0.0001). E: cardiac ultrasound was assessed at baseline and 48 h postinfection. Ejection fraction was significantly increased postinfection in WT (main effect for genotype, P = 0.0444, and for infection, P = 0.0021; post hoc, P = 0.0365; n = 5 or 6) rats. F: pulmonary ultrasonography revealed consolidation and B lines (red arrowheads) in both the wild-type and knockout rats, postinfection. Lung morphology showed a heterogeneous pattern of lung injury indicative of bilobar pneumonia. Statistics were done using two-way ANOVA with a Tukey’s multiple comparisons test unless otherwise stated. Summary data are reported as means ± standard deviation. Open symbols reflect female subjects and closed symbols indicate male subjects. GSAP, gamma-secretase activating protein. *Statistically significant difference.
Figure 2.
Figure 2.
GSAP contributes to innate immunity and alveolar-capillary barrier integrity. Blood was collected from the abdominal aorta of control and ExoY+-infected WT and KO rats and a complete blood count with differential, a cytokine immunoassay in plasma, and an electrolyte panel were analyzed. A: WT and KO rats exhibited neutrophilia (main effect for genotype, P = ns, and for infection, P ≤ 0.0002; post hoc, WT, P = 0.037 and KO, P = 0.0025) and monocytosis (main effect for genotype, P = ns, and for infection, P ≤ 0.0001; post hoc WT, P < 0.0001 and KO, P < 0.0001; WT, n = 8–10 and KO, n = 11 or 12), whereas lymphocyte count remained unchanged (main effect for genotype, P = ns, and for infection, P = ns; post hoc, P = ns), after infection. B: the proinflammatory cytokine MCP-1 was increased following infection in the WT rats (main effect for genotype, P = 0.0023, and for infection, P = 0.0411; post hoc P = 0.0096; n = 5 or 6). C: KO rats had an increase in the bicarbonate concentration (main effect for genotype, P = 0.0280, and for infection P = ns; post hoc P = 0.0411) and a decrease in the anion gap (main effect for genotype, P = ns, and for infection, P = ns; post hoc, P = 0.0317) when compared with the WT controls at baseline (n = 5–7). After infection, lactate was increased in both WT (P = 0.0006) and KO rats (P < 0.0001; main effect for genotype, P = ns, and for infection, P ≤ 0.0001), whereas only WT rats exhibited a significant decrease in arterial oxygenation (main effect for genotype, P = ns, and for infection, P = 0.0016; post hoc PaO2, P = 0.0029; n = 5–7). Statistics were determined by two-way ANOVA with Tukey’s multiple comparisons test. Summary data are reported as means ± standard deviation. Open symbols reflect female subjects and closed symbols indicate male subjects. GSAP, gamma-secretase activating protein; KO, knockout; MCP, monocyte chemoattractant protein; WT, wild type. *Statistically significant difference.
Figure 3.
Figure 3.
Infection evokes neutrophil recruitment to the airways. A: H&E staining of lung slices after ExoY+ infection shows inflammatory cell recruitment to the distal airways with consolidation and perivascular cuffing, consistent with pneumonia in both WT and KO rats. B: bronchoalveolar lavage fluid (BALF) was collected from WT and KO control and infected rats and analyzed using flow cytometry. Both the WT and KO infected rats had a higher number of cells in their BALF 48 h postinfection, indicating GSAP does not interfere with neutrophil recruitment. WT (P < 0.0001; n = 5–7) and KO (P < 0.0001; n = 5 or 6; main effect for genotype, P = ns, and for infection, P = ns) C: uninfected animals had similar numbers and types of cells in the airway. Cells retrieved from the BALF were selected based on their forward and side scatter and single cells selected from the forward scatter width and height. Single cells were labeled with a CD45 antibody targeting hematopoietic cells and a CD11b,c antibody targeting monocytes, granulocytes, macrophages, dendritic, and natural killer cells. CD45 and CD11b,c double positive cells were selected and then screened for cells within the population that interact with the macrophage antibody, CD68, and the granulocyte antibody, HIS48. The CD68 and HIS48 double positive cells were then labeled with the RP1 antibody targeting neutrophils. Few RP1 positive neutrophils were observed. D: neutrophils were recruited to the airways following infection. Forty-eight hours after infection, there was a significant increase in the number of CD45 and CD11b,c positive cells recovered from the airway. Within this population, there was also a significant increase in the number of CD68 low and HIS48 high cells, consistent with the presence of neutrophils in the airways. The CD68 low and HIS48 high cell population was positive for the neutrophil marker RP1. There was no difference in the number of neutrophils recovered in WT and KO animals (main effect for genotype, P = ns, and for infection, P ≤ 0.0001). Statistics were determined by two-way ANOVA with Tukey’s multiple comparisons test. Summary data are reported as means ± standard deviation. Closed symbols indicate male subjects. GSAP, gamma-secretase activating protein; H&E, hematoxylin-eosin; KO, knockout; WT, wild type. *Statistically significant difference.
Figure 4.
Figure 4.
GSAP contributes to disruption of the alveolar-capillary barrier and susceptibility to myocardial ischemia-reperfusion injury following infection. A: ExoY+ was introduced into the trachea of the isolated perfused lung and filtration coefficient (Kf) measured 4 h later. Infection increased Kf in the lungs from WT rats (P = 0.0003; n = 10 or 11), but did not increase Kf in the lungs from KO rats (P = ns; main effect for genotype, P ≤ 0.0001, and for infection, P = 0.0168). Kf in lungs from KO rats was significantly reduced when compared with wild-type rats postinfection (P = 0.0216; n = 10 or 11). Top left: summary data, means ± standard deviation, and the bottom left shows representative lungs before (baseline) and after infection (ExoY+). Red arrowheads highlight edematous lung regions. B: control and 48-h infected rats were assessed for myocardial susceptibility to 30 min of regional myocardial ischemia followed by 2 h of reperfusion. In uninfected rats, both WT and KO rats exhibited ∼45% infarction of the ischemic (risk) area and were not different from each other (P = ns between groups). Following infection, the percentage of the risk area that infarcted was increased by ∼30% in WT rats (P = 0.037; n = 5 or 6) and was increased compared with the KO rats following infection (P = 0.0028). Infarct size in the infected KO rats was not different from that in the uninfected KO rats (P = ns). A representative slice of the ischemic zone from a tetrazolium-stained heart from each of the four groups is shown below the summary data. The amount of infarct on each slice as determined by the ImageJ software is outlined. A black 1 cm scale line appears in each panel. Each slice was from a heart with an infarct size closest to the mean for each group. See the supplement for more details on the infarct sizing. Statistics were determined by two-way ANOVA with Tukey’s multiple comparisons test. Summary data are reported as means ± standard deviation. Open symbols reflect female subjects and closed symbols indicate male subjects. GSAP, gamma-secretase activating protein; KO, knockout; WT, wild type. *Statistically significant difference.
Figure 5.
Figure 5.
Gsap knockout rats exhibit elevated long-term potentiation, neurotransmitter release probability, and excitability. A, left: summary plot of long-term potentiation. Field excitatory postsynaptic potential (fEPSP) slopes were normalized to those before the theta-burst stimulation (TBS; delivered at time 0) and plotted against time (mean ± standard error of the mean). The bottom traces show averages of five representative traces obtained from time points “a” (−3-0 min; black), “b” (5–8 min; blue), and “c” (57–60 min; red) for uninfected baseline wild-type and Gsap knockout rats (WT, N = 30 slice recordings; KO, N = 29 slice recordings) and ExoY+ infected rats (WT, N = 40 recordings; KO, N = 25 recordings). Vertical and horizontal scale bars represent 0.1 mV and 5 ms, respectively. Middle: early LTP (E-LTP; 5–8 min post TBS) responses were plotted and compared. The response from uninfected WT was significantly higher than uninfected KO (P = 0.0016) and both WT (P < 0.0001) and KO (P < 0.0001) hippocampi following infection (main effect for genotype, P = ns, and for infection, P ≤ 0.0001). The late LTP (L-LTP; 57–60 min post TBS) plot shows that ExoY+ infection significantly reduced responses in both WT (P = 0.0024) and KO rats (P = 0.0179), and L-LTP trended toward a decrease in the WT rats after infection (P = 0.0791 vs. KO; main effect for genotype, P ≤ 0.0001, and for infection, P ≤ 0.0001). Right: ratio of the L-LTP vs. E-LTP plot shows that the amount of synaptic potentiation was higher in Gsap KO rats (WT vs. KO: before ExoY+: P = 0.0002 and after ExoY+: P = 0.01). Within the same genotype, there was no difference before and after infection (P = ns; main effect for genotype, P ≤ 0.0001, and for infection, P = ns). B: fiber volley was measured to assess the presynaptic depolarization-mediated axonal recruitment. The population spike, or “pop spike,” was measured as an indication of postsynaptic hyperexcitability. A representative fiber volley, postsynaptic response, and pop spike in hippocampi isolated from uninfected (left) and infected (right) animals is shown to illustrate these measurements. C, Left: representative elicited fEPSP traces in response to increasing stimulus intensity (0–100 µA with 10 µA increments). The red traces were elicited with 100 µA and highlight the appearance of population spike in WT only after ExoY+ infection and in KO with and without infection. From left to right, the first downward peak denotes presynaptic fiber volley elicited by Schaffer collateral electrical stimulation, and the next larger downward peak denotes the postsynaptic response; the third downward response indicates the population spike. Vertical and horizontal scale bars represent 0.3 mV and 5 ms, respectively. Middle: presynaptic fiber volley amplitudes were plotted against stimulus intensities, and the obtained slopes (FV vs. Stim) were compared across the four groups. KO hippocampi exhibited decreased presynaptic fiber volley amplitudes at baseline (WT, N = 30 recordings; KO, N = 30; P = 0.0246) and following ExoY+ infection (WT, N = 38; KO, N = 25; P = 0.041; main effect for genotype, P = 0.0004, and for infection, P = ns). Right: postsynaptic fEPSP slopes plotted against fiber volleys were line-fitted, and the slopes were compared. The postsynaptic responses were significantly different between WT and KO rats; baseline (WT vs. KO; P = 0.0027) and ExoY+ infected (WT vs. KO; P < 0.0001; main effect for genotype, P ≤ 0.0001, and for infection, P = ns). D, left: summary plot to study the presynaptic neurotransmitter release probability. A pair of stimuli were delivered to elicit fEPSPs. The paired-pulse ratios, determined from the amplitudes of second fEPSP over those of the first responses, were plotted against the interstimulus intervals (mean ± standard error of the mean). Uninfected WT showed significantly higher paired-pulse ratios at the 25 ms stimulus interval (WT vs. KO, P = 0.0196; WT vs. WT ExoY+, P = 0.0072; WT vs. KO ExoY+, P = 0.0037; main effect for genotype, P = ns, and for infection, P = 0.0248). Right: representative averages of five raw traces were overlaid, aligned, and normalized to the first fEPSP amplitude to show all evoked responses, and compared across the four groups. Vertical and horizontal scale bars represent 0.1 mV and 100 ms, respectively. E: population spike time was determined from the time between fiber volley peak (i.e., first downward peak in B) and the upward peak, between the postsynaptic response (second downward peak) and the population spike (third downward peak). When compared, the WT baseline was significantly different from the KO baseline (WT, N = 17 recordings; KO, N = 19; P = 0.0067), and from the ExoY+ infected WT (WT, N = 27; KO, N = 20; P = 0.0059). Statistics were determined by two-way ANOVA with Tukey’s multiple comparisons test. Summary data are reported as means ± standard deviation unless otherwise specified. Open symbols reflect female subjects and closed symbols indicate male subjects. GSAP, gamma-secretase activating protein; KO, knockout; WT, wild type. *Statistically significant difference.
Figure 6.
Figure 6.
GSAP contributes to neurotransmission in the hippocampus under basal conditions and to lung, heart, and brain dysfunction following pneumonia. A: schematic highlighting the roles of GSAP in hippocampal neurotransmission. The collective effect of GSAP on neurotransmission is to facilitate the presynaptic action potential while dampening the postsynaptic response, thereby mitigating neuronal excitability. formula image
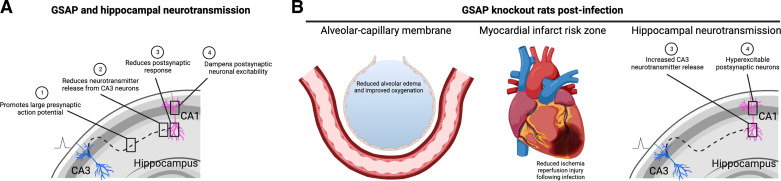
the presynaptic depolarizing current. B: the Gsap knockout rats exhibited improved lung and heart function following infection. In lung, the alveolar-capillary membrane was protected in the knockout animals. In heart, Gsap knockout animals were not protected from ischemia-reperfusion injury under baseline conditions, but did not exhibit the postinfection potentiation of the ischemia-reperfusion injury that was seen in wild-type animals. In the hippocampus, Gsap knockout rats exhibited increased CA3 neurotransmitter release and postsynaptic hyperexcitability following infection. GSAP, gamma-secretase activating protein. [Image created with BioRender.com and published with permission.]

References

    1. He G, Luo W, Li P, Remmers C, Netzer WJ, Hendrick J, Bettayeb K, Flajolet M, Gorelick F, Wennogle LP, Greengard P. Gamma-secretase activating protein is a therapeutic target for Alzheimer's disease. Nature 467: 95–98, 2010. doi:10.1038/nature09325. - DOI - PMC - PubMed
    1. Chu J, Li JG, Hoffman NE, Stough AM, Madesh M, Praticò D. Regulation of gamma-secretase activating protein by the 5Lipoxygenase: in vitro and in vivo evidence. Sci Rep 5: 11086, 2015. doi:10.1038/srep11086. - DOI - PMC - PubMed
    1. Chu J, Li JG, Joshi YB, Giannopoulos PF, Hoffman NE, Madesh M, Praticò D. Gamma secretase-activating protein is a substrate for caspase-3: implications for Alzheimer's disease. Biol Psychiatry 77: 720–728, 2015. doi:10.1016/j.biopsych.2014.06.003. - DOI - PMC - PubMed
    1. Chang JC, Xu P, Wong E, Flajolet M, Li YM, Greengard P. GSAP regulates amyloid β production through modulation of amyloid precursor protein trafficking. bioRxiv, 2020. doi:10.1101/2020.11.12.379313. - DOI
    1. Xu P, Chang JC, Zhou X, Wang W, Bamkole M, Wong E, Bettayeb K, Jiang LL, Huang T, Luo W, Xu H, Nairn AC, Flajolet M, Ip NY, Li YM, Greengard P. GSAP regulates lipid homeostasis and mitochondrial function associated with Alzheimer's disease. J Exp Med 218: e20202446, 2021. doi:10.1084/jem.20202446. - DOI - PMC - PubMed

Publication types

MeSH terms

Substances