Bayesian analysis of the Substrate Ablation vs. Antiarrhythmic Drug Therapy for Symptomatic Ventricular Tachycardia trial
- PMID: 37366571
- PMCID: PMC10326301
- DOI: 10.1093/europace/euad181
Bayesian analysis of the Substrate Ablation vs. Antiarrhythmic Drug Therapy for Symptomatic Ventricular Tachycardia trial
Abstract
Background and aims: Bayesian analyses can provide additional insights into the results of clinical trials, aiding in the decision-making process. We analysed the Substrate Ablation vs. Antiarrhythmic Drug Therapy for Symptomatic Ventricular Tachycardia (SURVIVE-VT) trial using Bayesian survival models.
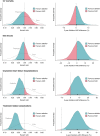
Methods and results: The SURVIVE-VT trial randomized patients with ischaemic cardiomyopathy and monomorphic ventricular tachycardia (VT) to catheter ablation or antiarrhythmic drugs (AAD) as a first-line strategy. The primary outcome was a composite of cardiovascular death, appropriate implantable cardioverter-defibrillator shocks, unplanned heart failure hospitalizations, or severe treatment-related complications. We used informative, skeptical, and non-informative priors with different probabilities of large effects to compute the posterior distributions using Markov Chain Monte Carlo methods. We calculated the probabilities of hazard ratios (HR) being <1, <0.9, and <0.75, as well as 2-year survival estimates. Of the 144 randomized patients, 71 underwent catheter ablation and 73 received AAD. Regardless of the prior, catheter ablation had a >98% probability of reducing the primary outcome (HR < 1) and a >96% probability of achieving a reduction of >10% (HR < 0.9). The probability of a >25% (HR < 0.75) reduction of treatment-related complications was >90%. Catheter ablation had a high probability (>93%) of reducing incessant/slow undetected VT/electric storm, unplanned hospitalizations for ventricular arrhythmias, and overall cardiovascular admissions > 25%, with absolute differences of 15.2%, 21.2%, and 20.2%, respectively.
Conclusion: In patients with ischaemic cardiomyopathy and VT, catheter ablation as a first-line therapy resulted in a high probability of reducing several clinical outcomes compared to AAD. Our study highlights the value of Bayesian analysis in clinical trials and its potential for guiding treatment decisions.
Trial registration: ClinicalTrials.gov identifier: NCT03734562.
Keywords: Anti-arrhythmic drugs; Bayesian analysis; Catheter ablation; Ventricular tachycardia.
© The Author(s) 2023. Published by Oxford University Press on behalf of the European Society of Cardiology.
Figures


References
-
- Wasserstein RL, Lazar NA. The ASA statement on p-values: context, process, and purpose. Am Stat Tayl Fran 2016;70:129–33.
-
- Mark DB, Lee KL, Harrell FE Jr. Understanding the role of P values and hypothesis tests in clinical research. JAMA Cardiology 2016;1:1048–54. - PubMed
Publication types
MeSH terms
Substances
Associated data
Grants and funding
LinkOut - more resources
Full Text Sources
Medical

