. 2023 Jul 10;148(14):3247-3256.
doi: 10.1039/d3an00751k.

Evaluating nanoparticle localisation in glioblastoma multicellular tumour spheroids by surface enhanced Raman scattering

Affiliations

Evaluating nanoparticle localisation in glioblastoma multicellular tumour spheroids by surface enhanced Raman scattering

Samantha M McCabe et al. Analyst. .

Abstract

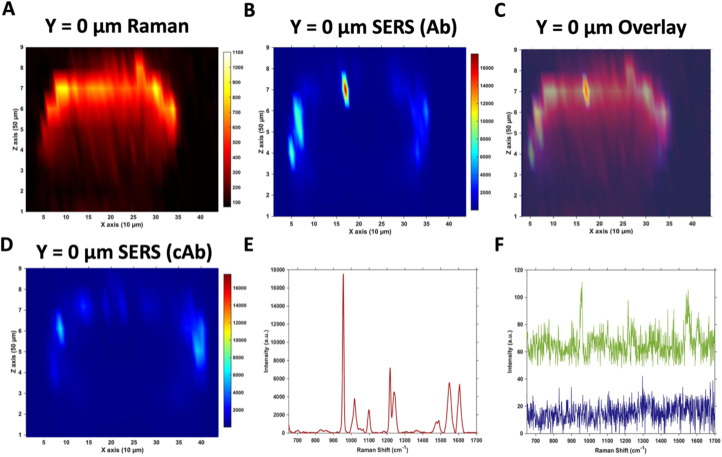
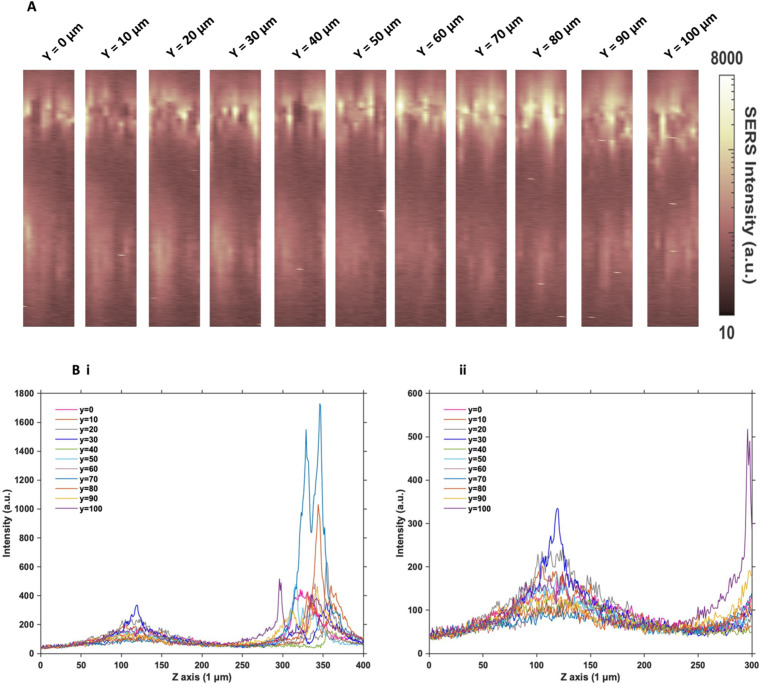
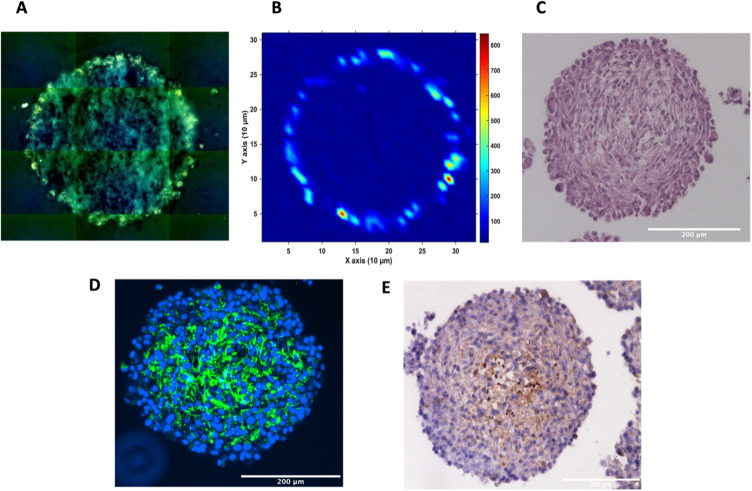
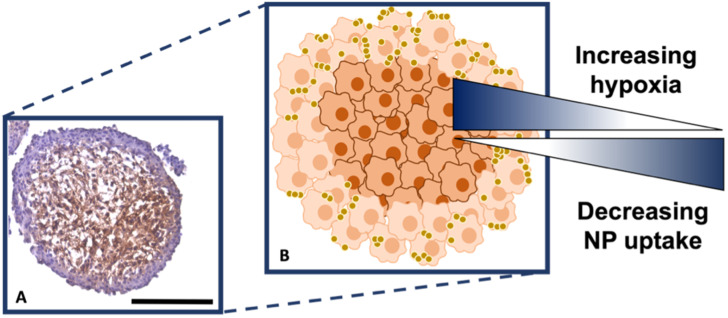
Glioblastoma multiforme (GBM) is a particularly aggressive and high-grade brain cancer, with poor prognosis and life expectancy, in urgent need of novel therapies. These severe outcomes are compounded by the difficulty in distinguishing between cancerous and non-cancerous tissues using conventional imaging techniques. Metallic nanoparticles (NPs) are advantageous due to their diverse optical and physical properties, such as their targeting and imaging potential. In this work, the uptake, distribution, and location of silica coated gold nanoparticles (AuNP-SHINs) within multicellular tumour spheroids (MTS) derived from U87-MG glioblastoma cells was investigated by surface enhanced Raman scattering (SERS) optical mapping. MTS are three-dimensional in vitro tumour mimics that represent a tumour in vivo much more closely than that of a two-dimensional cell culture. By using AuNP-SHIN nanotags, it is possible to readily functionalise the inner gold surface with a Raman reporter, and the outer silica surface with an antibody for tumour specific targeting. The nanotags were designed to target the biomarker tenascin-C overexpressed in U87-MG glioblastoma cells. Immunochemistry indicated that tenascin-C was upregulated within the core of the MTS, however limitations such as NP size, quiescence, and hypoxia, restricted the penetration of the nanotags to the core and they remained in the outer proliferating cells of the spheroids. Previous examples of MTS studies using SERS demonstrated the incubation of NPs on a 2D monolayer of cells, with the subsequent formation of the MTS from these pre-incubated cells. Here, we focus on the localisation of the NPs after incubation into pre-formed MTS to establish a better understanding of targeting and NP uptake. Therefore, this work highlights the importance for the investigation and translation of NP uptake into these 3D in vitro models.


Conflict of interest statement

There are no conflicts to declare.

Figures

Fig. 1
Fig. 1. Raman and SERS measurements of U87-MG GBM MTS incubated with 32 pM Ab and cAb nanotags for 4 hours. (A) 2D XZ Raman intensity map at 2930 cm−1 showing the CH3 cellular protein peak obtained using 532 nm laser excitation taken at y = 0 μm of the MTS. (B) 2D XZ SERS intensity maps at 956 cm−1 corresponding to the main intensity peak of the Raman reporter PPY on the Ab nanotags obtained using 785 nm laser excitation taken at y = 0 μm of the MTS. (C) Overlay of (A) and (B) to illustrate the nanotag signal is within the outer layer of cells of the MTS. (D) 2D XZ SERS intensity maps at 956 cm−1 corresponding to the main intensity peak of the Raman reporter PPY on the cAb nanotags obtained using 785 nm laser excitation taken at y = 0 μm of the MTS. (E) SERS spectrum of the Ab nanotags at the most intense area of (B) and (F) SERS spectra of the Ab nanotags from the centre of (B) (green) and from a point on the coverslip away from the spheroid (blue). All spectra were taken using a 1 s integration time and 100% laser power (785 nm, 20 mW and 532 nm, 30 mW). All measurements were taken on n = 3 MTS.
Fig. 2
Fig. 2. Z optical sectioning through U87-MG GBM MTS incubated with 32 pM Ab nanotags for 4 hours. (A) 3D SERS intensity maps at 956 cm−1 corresponding to the intensity of the main peak of the Raman reporter PPY on the nanotags. From left to right illustrates an increasing y plane taken throughout the entirety of the MTS at 10 μm increments. (B) Z profile for the PPY intensity illustrating the localisation of the Ab nanotags throughout the entire Z profile of the MTS where (i) shows the full Z range and (ii) is an expanded spectrum of the 0 to 300 μm region to show the signal at the bottom of the MTS. Spectra were taken using a 785 nm laser excitation, 1 s integration time and 100% laser power at 20 mW. All measurements were taken on n = 3 MTS.
Fig. 3
Fig. 3. Sectioned U87-MG GBM MTS. (A) White light montage image taken on a Renishaw InVia Raman microscope of the MTS section to illustrate the nanotags around the proliferating layer of the MTS incubated with 32 pM Ab nanotags and (B) a corresponding SERS intensity map using the 956 cm−1 PPY peak, (C) haematoxylin and eosin (H&E) staining, (D) immunofluorescence, where the presence of the green indicates tenascin-C (E) immunohistochemistry, where the presence of the brown colour indicates tenascin-C. (A) and (B) are of the same MTS section. (C–E) are sections of different MTS, however prepared at the same time and under the same conditions. SERS intensity map was taken using a 785 nm laser excitation, 1 second integration and a laser power of 10 mW. All measurements were taken on n = 3 MTS.
Fig. 4
Fig. 4. (A) Sectioned MTS showing hypoxic staining using pimonidazole, where the presence of the brown colour indicates hypoxia. (B) Schematic correlating hypoxia and NP uptake within the MTS based on (A). The outer, actively proliferating layer of cells of the MTS are coloured light orange, the quiescent and hypoxic cells are dark orange. The gold spheres illustrate the nanotags. Scale bar is 200 μm.

Similar articles

Cited by

References

    1. Cancer Research UK, https://www.cancerresearchuk.org/health-professional/cancer-statistics-f...
    2. , (accessed 10 January 2023)

    1. Cancer Research UK, https://www.cancerresearchuk.org/health-professional/cancer-statistics/s...
    2. , (accessed 10 January 2023)

    1. Trédan O. Galmarini C. M. Patel K. Tannock I. F. JNCI, J. Natl. Cancer Inst. 2007;99:1441–1454. doi: 10.1093/jnci/djm135. - DOI - PubMed
    1. Bowers H. J. Fannin E. E. Thomas A. Weis J. A. Sci. Rep. 2020;10:11583. doi: 10.1038/s41598-020-68324-4. - DOI - PMC - PubMed
    1. Kunz-Schughart L. A. Kreutz M. Knuechel R. Int. J. Exp. Pathol. 1998;79:1–23. doi: 10.1046/j.1365-2613.1998.00051.x. - DOI - PMC - PubMed