. 2023 Jul 12;145(27):14874-14883.
doi: 10.1021/jacs.3c03937. Epub 2023 Jun 27.

Optically Enhanced Solid-State 1H NMR Spectroscopy

Affiliations

Optically Enhanced Solid-State 1H NMR Spectroscopy

Federico De Biasi et al. J Am Chem Soc. .

Abstract

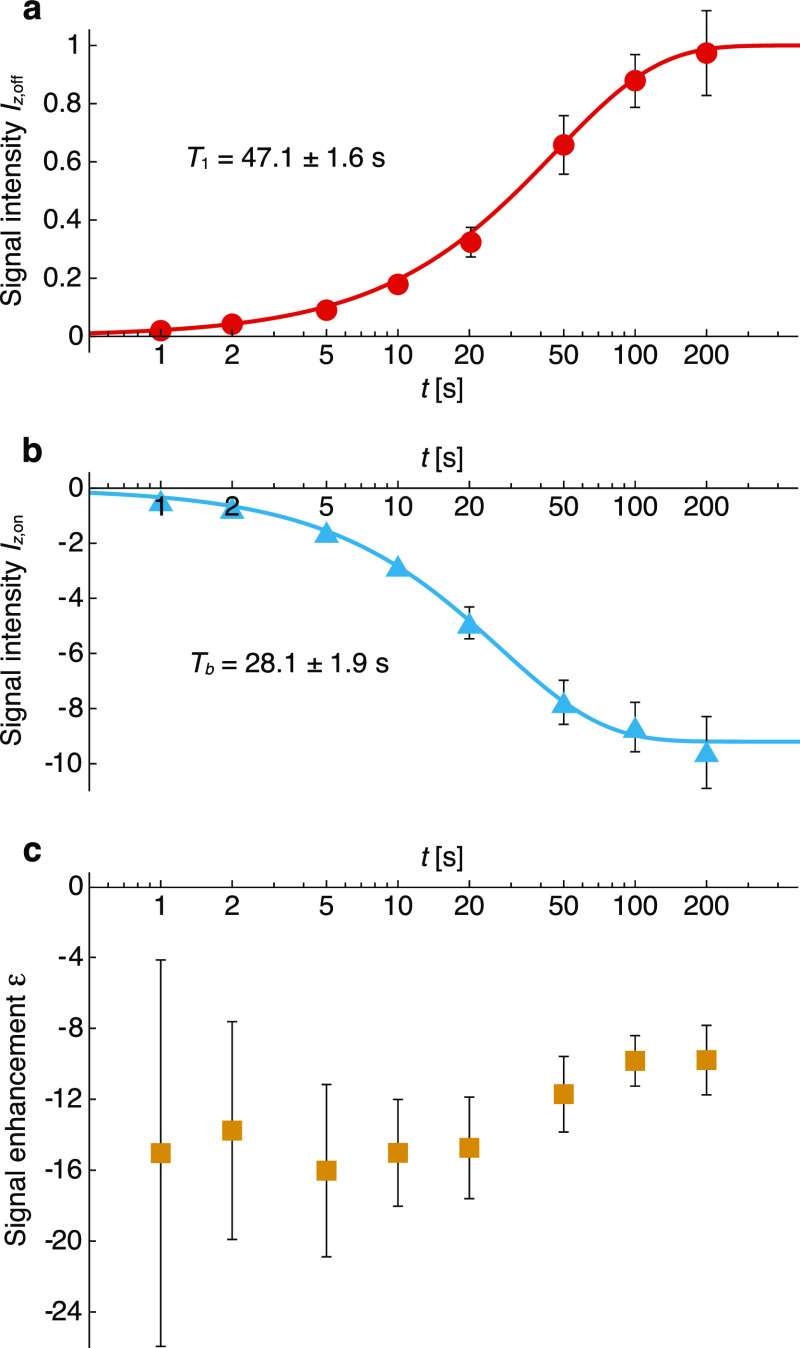
Low sensitivity is the primary limitation to extending nuclear magnetic resonance (NMR) techniques to more advanced chemical and structural studies. Photochemically induced dynamic nuclear polarization (photo-CIDNP) is an NMR hyperpolarization technique where light is used to excite a suitable donor-acceptor system, creating a spin-correlated radical pair whose evolution drives nuclear hyperpolarization. Systems that exhibit photo-CIDNP in solids are not common, and this effect has, up to now, only been observed for 13C and 15N nuclei. However, the low gyromagnetic ratio and natural abundance of these nuclei trap the local hyperpolarization in the vicinity of the chromophore and limit the utility for bulk hyperpolarization. Here, we report the first example of optically enhanced solid-state 1H NMR spectroscopy in the high-field regime. This is achieved via photo-CIDNP of a donor-chromophore-acceptor molecule in a frozen solution at 0.3 T and 85 K, where spontaneous spin diffusion among the abundant strongly coupled 1H nuclei relays polarization through the whole sample, yielding a 16-fold bulk 1H signal enhancement under continuous laser irradiation at 450 nm. These findings enable a new strategy for hyperpolarized NMR beyond the current limits of conventional microwave-driven DNP.


Conflict of interest statement

The authors declare the following competing financial interest(s): All the raw data presented here can be accessed at the following link www.doi.org/10.5281/zenodo.8033136 and is available under the CC-BY-4.0 (Creative Commons Attribution-ShareAlike 4.0 International) license.

Figures

Figure 1
Figure 1
Structures of molecules used in this work. The donor (MeOAn), chromophore (ANI), and acceptor (NDI) moieties in the photoactive part of the structure are shown in red, yellow, and blue, respectively. The linker units are shown in black.
Figure 2
Figure 2
Photocycle of the D–C–A system in (1) and (2); hν: photoexcitation, ISC: intersystem crossing, CR: charge recombination. The two-step electron transfer occurs on the picosecond timescale as D–C*–A → 1(D+•–C–•–A) → 1(D+•–C–A–•).
Figure 3
Figure 3
1H NMR spectra (12.8 MHz) of a 1 mM frozen solution of (1) in OTP at 85 K and 0.3 T without (red, 104 scans) and with (blue, 50 scans) 3.8 W/cm2 CW laser illumination at 450 nm. A short (15 μs) solid echo pulse sequence was applied prior to signal acquisition and the re-polarization delay between scans was 20 s. More details about the NMR pulse sequence, acquisition parameters, and suppression of probe acoustic ringing are given in the Methods section and in the Supporting Information. (Note that the greater noise level in the laser-on spectrum is due to 200 times fewer scans being acquired).
Figure 4
Figure 4
1H NMR spectra (12.8 MHz) of a 1 mM frozen solution of (1) in OTP (85 K and 0.3 T) recorded with CW laser illumination at 450 nm using different laser intensities (40 scans per experiment). The re-polarization delay between scans was 20 s.
Figure 5
Figure 5
Saturation recovery experiments plotting the 1H NMR integrated signal intensity without light [Iz,off, (a)], with 2.4 W/cm2 CW 450 nm light [Iz,on, (b)], and the signal enhancement [ε = Iz,on/Iz,off, (c)], as a function of re-polarization delay at 85 K for a 1 mM frozen solution of (1) in OTP at 0.3 T. The number of scans for each datapoint is given in Table S1. Data were fitted (solid lines) with a single exponential function having a time constant T1 (longitudinal relaxation with no laser) or Tb (polarization buildup under CW irradiation) to yield the values given in the inset. All data shown here are background subtracted (see Supporting Information for additional details). Error bars are calculated from the signal-to-noise ratios in the spectra. Some of the errors in (a,b) are smaller than the symbol size.
Figure 6
Figure 6
Steady-state 1H NMR integrated signal intensities in the presence of 3.8 W/cm2 CW 450 nm light as a function of temperature for a 1 mM frozen solution of (1) in OTP at 0.3 T. The re-polarization delay in the experiments performed at 90 and 110 K was 350 s; in all others it was 500 s (8 scans per experiment).
Figure 7
Figure 7
1H NMR spectra (12.8 MHz) of a 1 mM frozen solution of (2) in OTP at 85 K and 0.3 T without (red, 104 scans) and with (blue, 60 scans) 3.8 W/cm2 CW laser illumination at 450 nm. The re-polarization delay between scans was 20 s.

References

    1. Jiang Y.; Kalodimos C. G. NMR Studies of Large Proteins. J. Mol. Biol. 2017, 429, 2667–2676. 10.1016/j.jmb.2017.07.007. - DOI - PubMed
    1. Youngman R. NMR Spectroscopy in Glass Science: A Review of the Elements. Materials 2018, 11, 476.10.3390/ma11040476. - DOI - PMC - PubMed
    1. Boehr D. D.; Dyson H. J.; Wright P. E. An NMR Perspective on Enzyme Dynamics. Chem. Rev. 2006, 106, 3055–3079. 10.1021/cr050312q. - DOI - PubMed
    1. von der Heiden D.; Vanderkooy A.; Erdélyi M. Halogen bonding in solution: NMR spectroscopic approaches. Coord. Chem. Rev. 2020, 407, 213147.10.1016/j.ccr.2019.213147. - DOI
    1. Hodgkinson P. NMR crystallography of molecular organics. Prog. Nucl. Magn. Reson. Spectrosc. 2020, 118–119, 10–53. 10.1016/j.pnmrs.2020.03.001. - DOI - PubMed