Review
. 2023 Jun 4;13(6):618.
doi: 10.3390/bios13060618.

Recent Progress in Diboronic-Acid-Based Glucose Sensors

Affiliations
Review

Recent Progress in Diboronic-Acid-Based Glucose Sensors

Ke Nan et al. Biosensors (Basel). .

Abstract

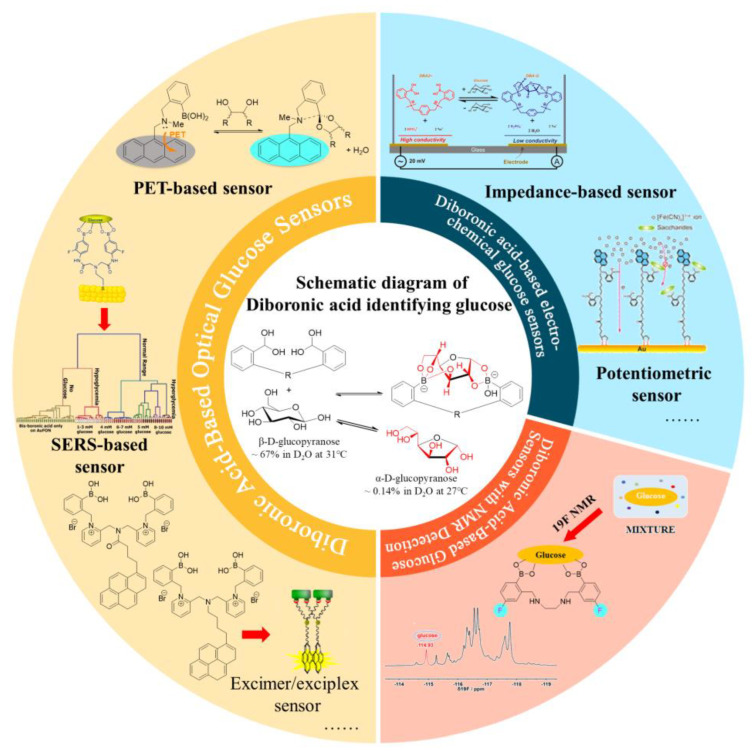
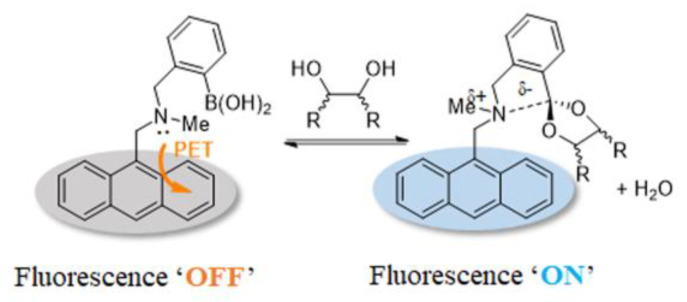
Non-enzymatic sensors with the capability of long-term stability and low cost are promising in glucose monitoring applications. Boronic acid (BA) derivatives offer a reversible and covalent binding mechanism for glucose recognition, which enables continuous glucose monitoring and responsive insulin release. To improve selectivity to glucose, a diboronic acid (DBA) structure design has been explored and has become a hot research topic for real-time glucose sensing in recent decades. This paper reviews the glucose recognition mechanism of boronic acids and discusses different glucose sensing strategies based on DBA-derivatives-based sensors reported in the past 10 years. The tunable pKa, electron-withdrawing properties, and modifiable group of phenylboronic acids were explored to develop various sensing strategies, including optical, electrochemical, and other methods. However, compared to the numerous monoboronic acid molecules and methods developed for glucose monitoring, the diversity of DBA molecules and applied sensing strategies remains limited. The challenges and opportunities are also highlighted for the future of glucose sensing strategies, which need to consider practicability, advanced medical equipment fitment, patient compliance, as well as better selectivity and tolerance to interferences.

Keywords: diboronic acid; glucose sensors; recognition mechanism.


Conflict of interest statement

The authors declare no conflict of interest.

Figures

Figure 19
Figure 19
(a) Schematic device architecture for impedance spectra and time resolution monitoring at high frequency; (b) Solution resistance (R) of 1 mL of test solution changes with continuous addition of 0.5 M or 2 M glucose concentration (2 mM in 2.5 mM Na3PO4, pH = 7.6); (c) Addition of galactose had a negligible effect on solution resistance. The addition of fructose caused a 3% increase in resistance under low glucose (5 mM) conditions and only a transient increase under high glucose (20 mM) conditions. Reprinted with permission from [70]. Copyright © 2019 Wiley OnlineLibrary; (d) Schematic diagram of diboronic-acid-immobilized electrodes; (e) Nyquist plots and (f) electron transfer resistances obtained applying 50 µL of 0.1 × PBS (pH 7.4) containing 10 mM Fe(CN)63−/4−, 0.1 M KCl, and glucose in the range of 0–500 mg/dL to the diboronic-acid-modified electrode. Reprinted with permission from [72]. Copyright © 2023 MDPI.
Figure 1
Figure 1
Common detection methods of diboronic-acid-based glucose sensors in recent years.
Figure 2
Figure 2
(a) Binding equilibria of phenylboronic acid with a diol [20]; (b) Equilibrium between the dominant form (pyranose, left) and the form that contains a syn-periplanar anomeric hydroxyl pair (furanose, right) of D-fructose, D-glucose, and D-galactose [21].
Figure 3
Figure 3
D-glucose was bound with sensor 1 in the β-pyranose form in deuterated methanol [23] and in the α-furanose form in basic aqueous media [24].
Figure 4
Figure 4
Schematic diagram of intramolecular charge transfer. The recognition of cis-diols with phenylboronic acid-conjugated ICT fluorophores may result in a blue-shift (a) or red-shift (b) of fluorescence emission depending on the structure of different molecular structures.
Figure 5
Figure 5
(a) The emission wavelength of sensor 2 blueshifts due to the interruption of the ICT state when saccharide is added (or an increase in pH); (b) The emission wavelength of sensor 3 redshifts due to the interruption of the ICT state when saccharide is added (or an increase in pH). (Colors are used to describe the red and blue shift in the emission wavelengths, not the actual color of the emitted light.)
Figure 6
Figure 6
Schematic diagram of photoinduced electron transfer.
Figure 7
Figure 7
The chemical structures of PET sensors 412.
Figure 8
Figure 8
Illustration of the anthracene-based PET system.
Figure 9
Figure 9
(a) Fluorescence excitation and emission spectra of CN-DBA (10 μM in 0.5% MeOH/PBS, pH = 7.4) before and after adding glucose (0.1 M) (λex = 375 nm, λem = 427 nm); (b) Fluorescence changes (F/F0) of P-DBA and CN-DBA in 1.56 mM saccharides; (c) Illustration of the fluorescence responses of CN-DBA against 0.1 M glucose under different pH values. Reprinted with permission from [45]. Copyright © 2021 American Chemical Society; (d) Relative fluorescence of sensor 7 (10−5 M, 0.05 M aqueous phosphate buffer, pH 7.4) as a function of carbohydrate concentration [44]. Reprinted with permission from [44]. Copyright © 1999 American Chemical Society.
Figure 10
Figure 10
(a) Schematic illustration of the sensing mechanism of 9a for glucose and its bioimaging applications in this work. Reprinted with permission from [46]. Copyright 2023 The Authors. Published by American Chemical Society; (b) the emission spectra of sensor 10b with glucose (in PBS buffer/10% MeOH, pH = 7.40, λex = 350 nm). Reprinted with permission from [47]. Copyright © 2023 American Chemical Society.
Figure 11
Figure 11
(a) Schematic diagram of the recognition of saccharides using inter-molecular PET system based on diboronic acid 12ac and HPTS; (b) Fluorescence response of sorbitol and different monosaccharides based on HPTS/12ac ensembles at pH 7.4 using a fluorescence plate reader; (c) Two-dimensional canonical score plot of seven analytes (1 mM) analyzed by LDA. Reprinted with permission from [50]. Copyright © 2015 Wiley Online Library.
Figure 12
Figure 12
Fluorescence spectral change of 13 with different concentrations of D-glucose (2.5 μM in buffer, pH = 8.21, λex = 299 nm). Reprinted with permission from [52]. Copyright © 2002 American Chemical Society.
Figure 13
Figure 13
(a) Molecular structure of sensor 14a and 14b; (b) Hypothetical binding modes between diboronic acids and monosaccharides; (c,d) Relative ratios of fluorescence signals towards monosaccharides using 14a (c) or 14b (d) as a sensor at pH 10.0. Reprinted with permission from [54]. Copyright © 2016 American Chemical Society.
Figure 14
Figure 14
(a) Greater distinction between spectra can be found when coupling hierarchical cluster analysis (HCA) with PCA. The hypoglycemia (1–3 mM), normal (4–8 mM), and hyperglycemia (>8 mM) can be distinguished by the HCA; (b) SERS difference spectrum of a 5 mM glucose and 5 mM fructose mixture (purple), the normal Raman spectra of a saturated glucose solution (red) and fructose (green). The dashed lines indicate peaks in the SERS spectrum that arise from glucose or fructose. Reprinted with permission from [57]. Copyright © 2016 American Chemical Society.
Figure 15
Figure 15
Fluorescence emission spectra (a) of 16 in the presence (as well as absence) of various monosaccharides at the end of titrations associated with fluorescence image under irradiation with 365 nm UV light (b). Reprinted with permission from [61]. Copyright © 2021 Wiley OnlineLibrary.
Figure 16
Figure 16
The chemical structures of electrochemical sensors 1722.
Figure 17
Figure 17
(a) Schematic diagram of the ferrocene-boronic acid bound to saccharide; (b) The DPV of 17 with different concentrations of D-glucose (50 μM in 52.1 wt.% methanol, pH 8.21). Reprinted with permission from [65]. Copyright © 2002 Royal Society of Chemistry; (c) Schematic illustration of MCGP sensing array based on SDBA-PtAu/CNTs nanozyme; (d,e) Response performances of glucose electrode group to glucose at different pH (d) and temperature (e). Reprinted with permission from [66]. Copyright © 2022 Elsevier B.V.
Figure 18
Figure 18
(a) Representation of gold surface functionalization by 19 and saccharide binding; (b,c) The detection of saccharides by CV (b) and EIS (c) (in PBS containing 5 mM Fe(CN)63−/4− (1:1) with 0.1 M KNO3, pH = 8.0). Reprinted with permission from [68]. Copyright © 2013 Royal Society of Chemistry; (d) Schematic diagram of SPR detection glucose; (e) SPR kinetic measurements detection of different saccharides concentrations (D-glucose, D-galactose, D-fructose, and D-mannose); (f) The calibration curve of SPR response change for diboronic acid sensor with different saccharides (glucose (red), fructose (blue), galactose (black), and mannose (green)). Reprinted with permission from [69]. Copyright © 2013 Royal Society of Chemistry.
Figure 20
Figure 20
(a) 19F NMR spectrum of sensor 24 (10 mM, EtOH containing 10% D2O and 2 mM NaOH) in the presence of a mixture containing 10 kinds of different saccharides (10 mM for each saccharide, pH 7.4); (b) 19F NMR intensity at δ19F −114.93 ppm after 10 kinds of different saccharides (10 mM for each saccharide) addition into sensor 24 (10 mM, EtOH containing 10% D2O and 2 mM NaOH) for 2 h, respectively. Reprinted with permission from [76]. Copyright © 2021 American Chemical Society; (c) 19F NMR spectra of sensor 25 in the presence of a D-/L-glucose in pH 9.0 buffer in D2O. Reprinted with permission from [77]. Copyright © 2018 American Chemical Society.

Similar articles

Cited by

References

    1. Combettes M.M. GLP-1 and type 2 diabetes: Physiology and new clinical advances. Curr. Opin. Pharmacol. 2006;6:598–605. doi: 10.1016/j.coph.2006.08.003. - DOI - PubMed
    1. Ginter E., Simko V. Type 2 diabetes mellitus, pandemic in 21st century. Adv. Exp. Med. Biol. 2013;771:42–50. - PubMed
    1. ERFC Diabetes mellitus, fasting blood glucose concentration, and risk of vascular disease: A collaborative meta-analysis of 102 prospective studies. Lancet. 2010;375:2215–2222. doi: 10.1016/S0140-6736(10)60484-9. - DOI - PMC - PubMed
    1. Kuzulugil D., Papeix G., Luu J., Kerridge R.K. Recent advances in diabetes treatments and their perioperative implications. Curr. Opin. Anaesthesiol. 2019;32:398–404. doi: 10.1097/ACO.0000000000000735. - DOI - PMC - PubMed
    1. Cefalu W.T., Buse J.B., Tuomilehto J., Fleming G.A., Ferrannini E., Gerstein H.C., Bennett P.H., Ramachandran A., Raz I., Rosenstock J., et al. Update and next steps for real-world translation of interventions for type 2 diabetes prevention: Reflections from a diabetes care editors’ expert forum. Diabetes Care. 2013;39:1186–1201. doi: 10.2337/dc16-0873. - DOI - PMC - PubMed

LinkOut - more resources