Review
. 2023 Jun 13;13(6):648.
doi: 10.3390/bios13060648.

Current Practice in Using Voltage Imaging to Record Fast Neuronal Activity: Successful Examples from Invertebrate to Mammalian Studies

Affiliations
Review

Current Practice in Using Voltage Imaging to Record Fast Neuronal Activity: Successful Examples from Invertebrate to Mammalian Studies

Nikolay Aseyev et al. Biosensors (Basel). .

Abstract

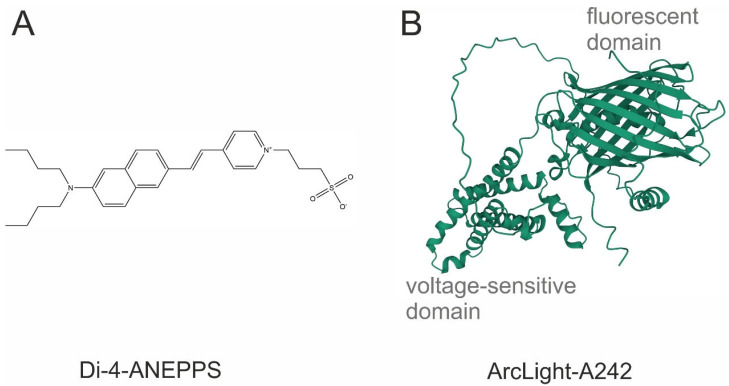
The optical imaging of neuronal activity with potentiometric probes has been credited with being able to address key questions in neuroscience via the simultaneous recording of many neurons. This technique, which was pioneered 50 years ago, has allowed researchers to study the dynamics of neural activity, from tiny subthreshold synaptic events in the axon and dendrites at the subcellular level to the fluctuation of field potentials and how they spread across large areas of the brain. Initially, synthetic voltage-sensitive dyes (VSDs) were applied directly to brain tissue via staining, but recent advances in transgenic methods now allow the expression of genetically encoded voltage indicators (GEVIs), specifically in selected neuron types. However, voltage imaging is technically difficult and limited by several methodological constraints that determine its applicability in a given type of experiment. The prevalence of this method is far from being comparable to patch clamp voltage recording or similar routine methods in neuroscience research. There are more than twice as many studies on VSDs as there are on GEVIs. As can be seen from the majority of the papers, most of them are either methodological ones or reviews. However, potentiometric imaging is able to address key questions in neuroscience by recording most or many neurons simultaneously, thus providing unique information that cannot be obtained via other methods. Different types of optical voltage indicators have their advantages and limitations, which we focus on in detail. Here, we summarize the experience of the scientific community in the application of voltage imaging and try to evaluate the contribution of this method to neuroscience research.

Keywords: GEVI; VSD; neuron; neuronal activity; optical recording; voltage imaging; voltage-sensitive dyes.


Conflict of interest statement

The authors declare no conflict of interests.

Figures

Figure 1
Figure 1
The chemical structure of the most common potentiometric sensors. (A) Di-4-ANEPPS, a VSD; (B) ArcLight A242, a GEVI. Sequence obtained from [20]. Three-dimensional view was generated with AlphaFold2.
Figure 2
Figure 2
Schematic comparison of optical recording with a Ca2+ indicator (CaI), GEVI, and VSD with electrophysiological recording (patch) under ideal, low-noise conditions. (A) Single AP recordings show a relatively longer delay of the CaI signal compared to that of the GEVI signal. (B) In contrast to CaI, both GEVI and VSD show almost perfect discrimination of single APs in spike train. It is worth noting that the response of many GEVIs has more than one time constant. As a result, the amplitude of fast signals will not be reproduced in a linear fashion. Synthetic electrochromic VSDs, on the other hand, are linear without delay.
Figure 3
Figure 3
Example of spiking activity of molluscan neurons recorded using the absorption VSD (Rh155) and photodiode array. (A,B) Discrimination of recorded optically individual neuronal action potentials (APs). (A) Scheme of the cell’s body projection (gray circle) on the two photodiodes: #72 (cell number) and #67 (red squares). (B) Matching of single neuronal electrophysiological recording of the neuron #72 with a sharp electrode (blue trace) to the optical signals from photodiodes #72 and #67 (cell numbers are indicated by red squares). Individual AP timings are represented by vertical gray lines and black bars in the lower diagram. (C) Example of analysis of the population response of the Helix pedal serotonergic cells to electrical stimulation of the 2nd cutaneous sensory nerve. Projections of the cell bodies onto the photodiode array (right) with medial group (violet circles) and lateral group (light orange circles) are shown. Arrows point to the population response histograms (left) of individual groups. (D) Individual spiking of neurons used for the analysis and grouping shown in C. Each numbered line of spikes corresponds to one of the neurons drawn on the array in C (right). (*) Peaks of network firing. Data obtained by the authors.
Figure 4
Figure 4
Visualization of action potential propagation in the axon of L5 pyramidal neuron stained with VSD JPW1114. Electrophysiological recording of the AP (upper left blue trace) and the corresponding spatial sequence of action potential signals (top red traces) recorded at axonal sites indicated by dashed white squares in the drawing below. Frames of the AP initiation and propagation. Normalized fine-scale signals from the axonal initial segment (AIS) and the first Ranvier node are shown (right bottom image). Optical recording obtained by the authors using a 63× lens (1 N.A.) and the RedShirtImging SMQ camera at 10 K fps. Data obtained by the authors.

References

    1. Salzberg B.M., Zecevic D. Pioneers in Neurophotonics: Special Section Honoring Professor Lawrence B. Cohen. Neurophotonics. 2015;2:021001. doi: 10.1117/1.NPh.2.2.021001. - DOI - PMC - PubMed
    1. Davila H.V., Salzberg B.M., Cohen L.B., Waggoner A.S. A large change in axon fluorescence that provides a promising method for measuring membrane potential. Nat. New Biol. 1973;241:159–160. doi: 10.1038/newbio241159a0. - DOI - PubMed
    1. Peterka D.S., Takahashi H., Yuste R. Imaging voltage in neurons. Neuron. 2011;69:9–21. doi: 10.1016/j.neuron.2010.12.010. - DOI - PMC - PubMed
    1. Fluhler E., Burnham V.G., Loew L.M. Spectra, membrane binding, and potentiometric responses of new charge shift probes. Biochemistry. 1985;24:5749–5755. doi: 10.1021/bi00342a010. - DOI - PubMed
    1. Kuhn B., Fromherz P. Anellated Hemicyanine Dyes in a Neuron Membrane: Molecular Stark Effect and Optical Voltage Recording. J. Phys. Chem. B. 2003;107:7903–7913. doi: 10.1021/jp0345811. - DOI