. 2023 May 24;45(6):4557-4573.
doi: 10.3390/cimb45060289.

Metabolic Silencing via Methionine-Based Amino Acid Restriction in Head and Neck Cancer

Affiliations

Metabolic Silencing via Methionine-Based Amino Acid Restriction in Head and Neck Cancer

Anna Chiara Wünsch et al. Curr Issues Mol Biol. .

Abstract

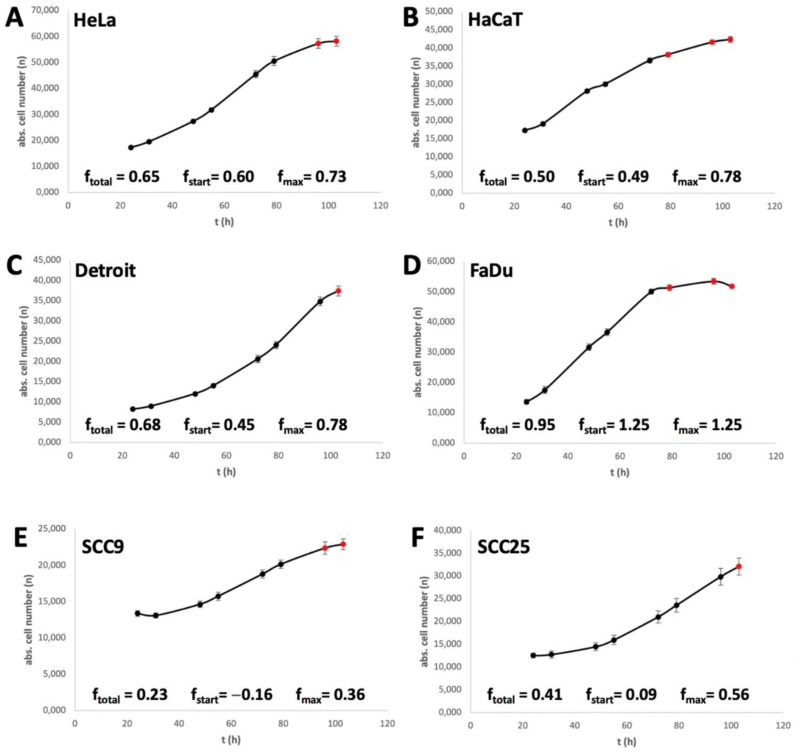
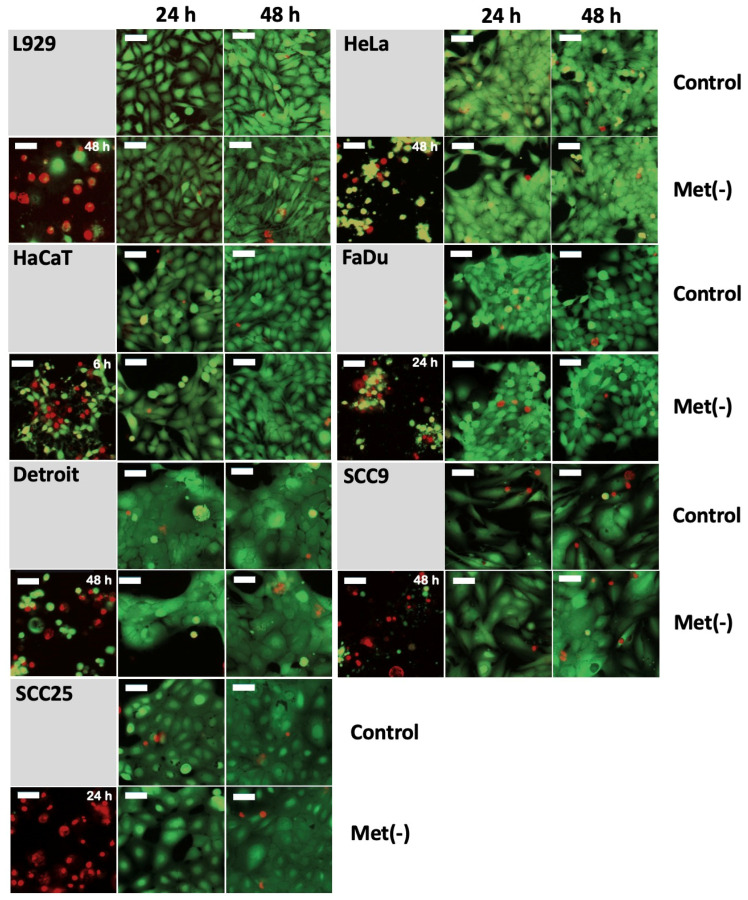
In recent years, various forms of caloric restriction (CR) and amino acid or protein restriction (AAR or PR) have shown not only success in preventing age-associated diseases, such as type II diabetes and cardiovascular diseases, but also potential for cancer therapy. These strategies not only reprogram metabolism to low-energy metabolism (LEM), which is disadvantageous for neoplastic cells, but also significantly inhibit proliferation. Head and neck squamous cell carcinoma (HNSCC) is one of the most common tumour types, with over 600,000 new cases diagnosed annually worldwide. With a 5-year survival rate of approximately 55%, the poor prognosis has not improved despite extensive research and new adjuvant therapies. Therefore, for the first time, we analysed the potential of methionine restriction (MetR) in selected HNSCC cell lines. We investigated the influence of MetR on cell proliferation and vitality, the compensation for MetR by homocysteine, the gene regulation of different amino acid transporters, and the influence of cisplatin on cell proliferation in different HNSCC cell lines.

Keywords: HNSCC; SCCHN; SLC-family; amino acid restriction; amino acid transporter; caloric restriction; cell vitality; cisplatin; low energy metabolism; methionine.


Conflict of interest statement

The authors declare no conflict of interest.

Figures

Figure 1
Figure 1
Analysis of proliferation in different cell lines subjected to restriction of the amino acid methionine. (ag) In each case, 10,000 cells/well were seeded on 96-well plates and stimulated in triplicate on the following day with a control medium or Met(-) medium. Absolute cell counts were analysed at 0 h, 24 h, 72 h, and 120 h using digital microscopy with the ImageXpress Pico automated cell imaging system. A summary of the results from three experimental replicates (n = 3) is shown in each case. (h) Summary of the proliferation analysis based on relative cell number counted using crystal violet staining. In each case, 10,000 cells/well were seeded on 96-well plates and stimulated the following day with a control medium (set as 100%) or Met(-) medium. Cells were analysed at 24 h, 48 h, 72 h, 96 h, and 120 h. A summary of the results from three experimental replicates (n = 3) is shown in each case (* p < 0.05, ** p < 0.01; *** p < 0.001).
Figure 2
Figure 2
Analysis of the cell progression rate. (AF) Cells were seeded at 10,000 cells/well in a 96-well plate. After 24, 31, 48, 55, 72, 79, 96, and 103 h, cell numbers were measured as described in Section 2 under Pico Assay (2.3). The summarised results (n = 3) are shown in Figure 2.
Figure 3
Figure 3
Homocysteine (Hcy)-based competition of MetR in different cell lines. (ag) In each case, 10,000 cells/well were seeded on 96-well plates and stimulated in triplicate on the following day with control medium, Met(-) medium, or Met(-) medium to which 800 μM Hcy had been added (Met(-)/Hcy). Cells were analysed at 0 h, 72 h, and 120 h using the ImageXpress Pico automated cell imaging system to determine absolute cell counts. A summary of the results from three experimental replicates (n = 3) is shown in each case (ns; nonsignificant; * p < 0.05, ** p < 0.01; *** p < 0.001).
Figure 4
Figure 4
The cell lines L929, HeLa, HaCaT, Detroit562, FaDu, SCC9, and SCC25 were seeded at 10,000 cells/well on a 96-well plate. On the following day, the medium was removed, and the cells were stimulated with full or Met(-) medium. Cells stimulated with 1 µM staurosporine served as the dead control cells. After 6 h, 24 h, and 48 h, measurements were performed with the “EarlyTox Live/Dead Assay Kit” (Molecular Devices). Measurements were made using the “Cell Scoring: 3 Channels” program of the ImageXpress Pico Automated Cell Imaging System (Molecular Devices) with a 10× magnification. The cytoplasm of leaving cells was measured in the FITC channel with CAM, and dead cells were measured in Texas Red-(TRITC)-channel with EthD-III. The results for 24 h and 48 h are shown. The 6 h time point showed no cell death for the control or MetR group. The dead cell control is on the left side for every cell line, and the time of the dead cell control measurement is indicated in the upper right corner. The size of the white bar corresponds to 52.44 µm. For each experimental condition, two wells were evaluated. The experiment was performed two times independently. The representative results of one experiment are shown. For better resolution, the figures are also added as a supplement (Suppl. Figure S1—Live/Dead Assay Figures).
Figure 5
Figure 5
Analysis of the gene expression of different amino acid transporters. The cells were stimulated for 24 h or 72 h with or without methionine in the corresponding medium. The isolated RNA was transcribed into cDNA, and the relative expression was determined by RT–PCR using the 2−ΔΔCt method. β-Actin was used as a standard. The results of the relative expression of the samples under MetR are shown. The dashed line represents an unchanged expression at a value of 1. The total of three independent experiments is shown individually, with the corresponding value of each experiment for 24 h and 72 h. Each PCR value was determined as a triplet. The range (error range) of each measured value is marked by error bars. An overview of the numeric results is attached as a table in the supplement (Suppl. S2—RT_PCR_Results_Total).
Figure 6
Figure 6
Analysis of the efficacy of cisplatin under MetR. (af) A total of 10,000 cells/well were seeded on 96-well plates. On the following day, cells were incubated in triplicate with control or Met(-) medium and a log2 dilution of cisplatin, with a starting concentration of 400 µM (12.5 µM for HeLa and 50 µM for FaDu). After 72 h, the cells were analysed using the ImageXpress Pico automated cell imaging system to determine absolute cell numbers. To compare the efficacy of cisplatin under different conditions, we used the IC50, which is defined as the concentration at which the drug reaches its half-maximal efficacy. For this purpose, the absolute cell counts (shown on the left side for each cell line) must be converted into percentages (shown on the right side for each cell line). The respective control value (without cisplatin) was set as 100%, and the lowest value in a measurement series was set as 0%. If one now places the two curves in a diagram, one can see whether there is a shift in the curve and, thus, a change in the IC50. For objective representation, the results of the absolute cell numbers are shown for each cell line, as well as the normalised representation in percent to the right. The dashed line indicates the inhibition of proliferation at 50% (IC50). The experiments were carried out three times. The figures show a summary of the experiments (n = 3) in one diagram.

Similar articles

Cited by

References

    1. Kamangar F., Dores G.M., Anderson W.F. Patterns of cancer incidence, mortality, and prevalence across five continents: Defining priorities to reduce cancer disparities in different geographic regions of the world. J. Clin. Oncol. 2006;24:2137–2150. doi: 10.1200/JCO.2005.05.2308. - DOI - PubMed
    1. Torre L.A., Bray F., Siegel R.L., Ferlay J., Lortet-Tieulent J., Jemal A. Global cancer statistics, 2012. CA Cancer J. Clin. 2015;65:87–108. doi: 10.3322/caac.21262. - DOI - PubMed
    1. Hosios A.M., Hecht V.C., Danai L.V., Johnson M.O., Rathmell J.C., Steinhauser M.L., Manalis S.R., Vander Heiden M.G. Amino acids rather than glucose account for the majority of cell mass in proliferating mammalian cells. Dev. Cell. 2016;36:540–549. doi: 10.1016/j.devcel.2016.02.012. - DOI - PMC - PubMed
    1. Gillespie Z.E., Pickering J., Eskiw C.H. Better living through chemistry: Caloric restriction (CR) and CR mimetics alter genome function to promote increased health and lifespan. Front. Genet. 2016;7:142. doi: 10.3389/fgene.2016.00142. - DOI - PMC - PubMed
    1. Mirzaei H., Suarez J.A., Longo V.D. Protein and amino acid restriction, aging and disease: From yeast to humans. Trends Endocrinol. Metab. TEM. 2014;25:558–566. doi: 10.1016/j.tem.2014.07.002. - DOI - PMC - PubMed