. 2023 Jun 19;8(2):85.
doi: 10.3390/jfmk8020085.

Unilaterally Induced Quadriceps Fatigue during Sustained Submaximal Isometric Exercise Does Not Alter Contralateral Leg Extensor Performance

Affiliations

Unilaterally Induced Quadriceps Fatigue during Sustained Submaximal Isometric Exercise Does Not Alter Contralateral Leg Extensor Performance

Brian Benitez et al. J Funct Morphol Kinesiol. .

Abstract

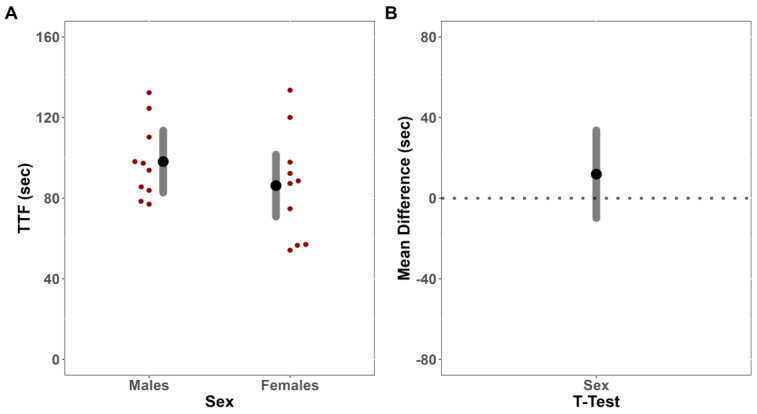
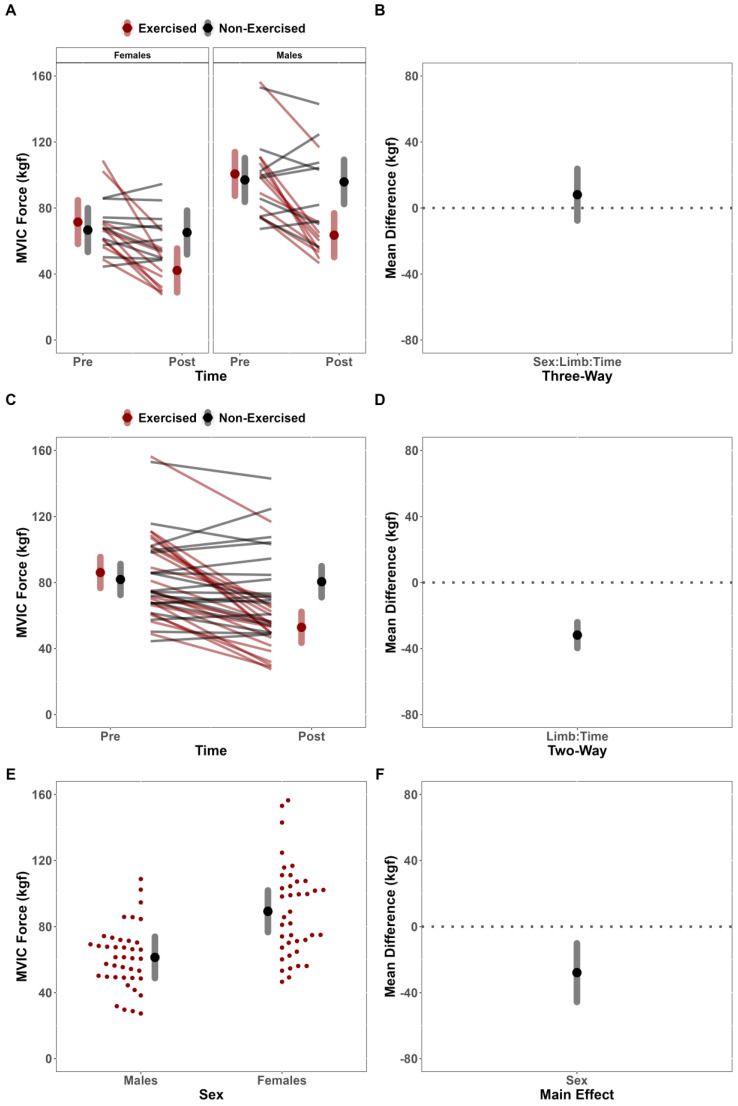
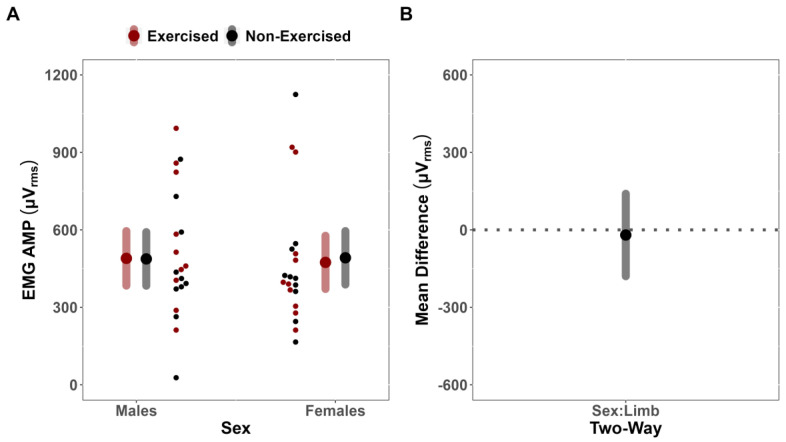
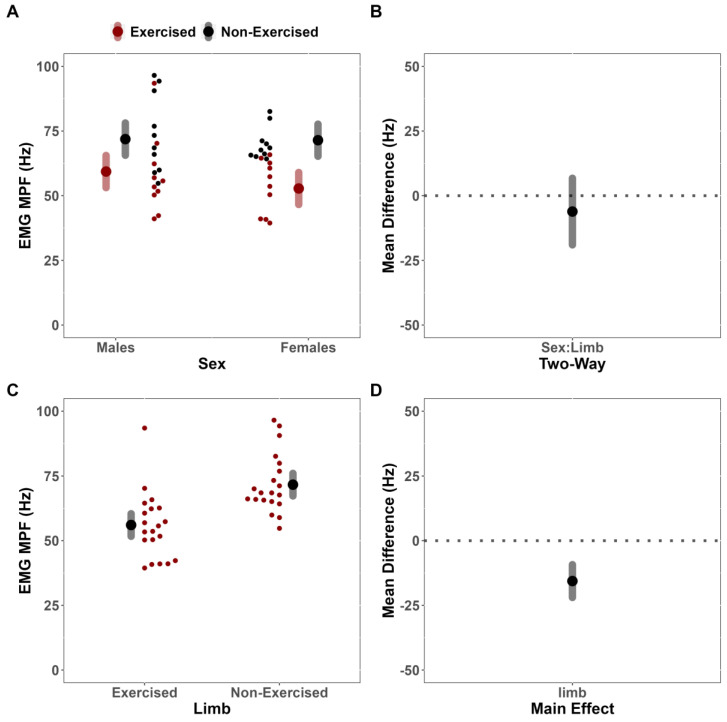
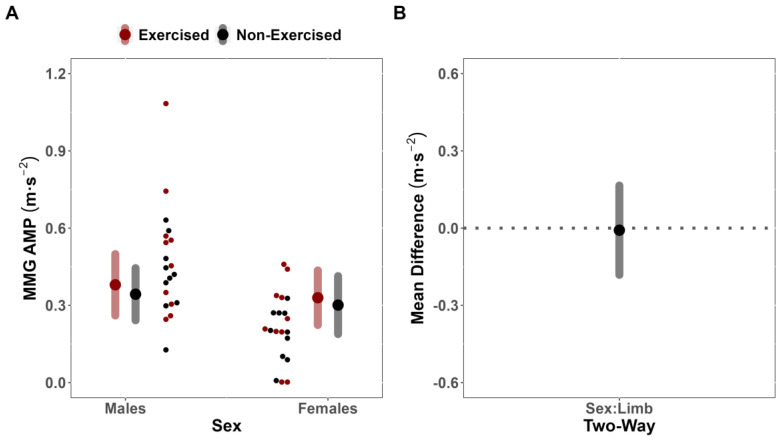
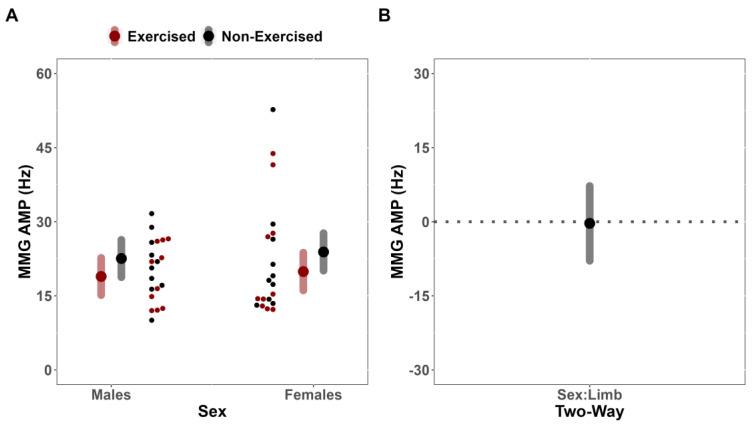
This study investigated the effects of fatiguing unilateral exercise on the ipsilateral, exercised, and contralateral, non-exercised limb's post-exercise performance in males and females. Ten males and ten females performed a fatiguing, unilateral isometric leg extension at 50% maximal voluntary isometric contraction (MVIC) force. Prior to and immediately after the fatiguing tasks, MVICs were performed for the exercised and non-exercised limb, with surface electromyographic (sEMG) and mechanomyography (sMMG) amplitude (AMP) and mean power frequency (MPF) recorded from each limb's vastus lateralis. There were no fatigue-induced, sex-dependent, differences in time to task failure (p = 0.265) or ipsilateral performance fatigability (p = 0.437). However, there was a limb by time interaction (p < 0.001) which indicated decreases in MVIC force of the ipsilateral, exercised (p < 0.001), but not the contralateral, non-exercised limb (p = 0.962). There were no sex-dependent, fatigue-induced differences in neurophysiological outcomes between the limbs (p > 0.05), but there was a fatigue-induced difference in sEMG MPF (p = 0.005). To summarize, there were no differences in fatigability between males and females. Moreover, there was insufficient evidence to support the presence of a general crossover effect following submaximal unilateral isometric exercise. However, independent of sex, the neurophysiological outcomes suggested that competing inputs from the nervous system may influence the performance of both limbs following unilateral fatigue.

Keywords: cross-over effects; non-localized muscle fatigue; performance fatigability.


Conflict of interest statement

The authors declare no conflict of interest.

Figures

Figure 1
Figure 1
Time-to-task failure (TTF) analysis. (A) Estimated marginal means (large black dots) and 95% confidence intervals (CI95%) (grey band), paired with individual data (small red dots), for the comparison of TTF between males and females. (B) Comparison of mean difference (large black dot) (illustrated with CI95%, grey band) for TTE between males and females.
Figure 2
Figure 2
Maximal voluntary isometric contraction force (MVIC) analysis. (A) Estimated marginal means (large red/black dots) and 95% confidence intervals (CI95%) (red/grey band), paired with individual data (red/black lines), for the changes in MVIC force of the exercised and non-exercised limb, separated by sex. (B) Comparison of mean difference (black dot) (illustrated with CI95%, grey band) for change in MVIC force between limbs, compared across sex. (C) Estimated marginal means (large red/black dots) and CI95% (red/grey band), paired with individual data (red/black lines), for the changes in MVIC force of the exercised and non-exercised limb, adjusted for sex. (D) Comparison of mean difference (black dot) (illustrated with CI95%, grey band) for change in MVIC force between limbs, adjusted for sex. (E) Estimated marginal means (large black dots) and CI95% (grey bands), paired with individual data (small red dots), for the MVIC force of males and females, adjusted for Time and Limb. (F) Comparison of mean difference (black dot) (illustrated with CI95%, grey band) for MVIC force between Sexes, adjusted for Time and Limb.
Figure 3
Figure 3
Surface electromyographic amplitude (sEMG AMP) analysis. (A) Estimated marginal means (Large red/black dots) and 95% confidence intervals (CI95%) (grey/red bands), paired with individual data (small red/black dots), for the effects of fatigue on sEMG AMP of the exercised and non-exercised limb, separated by Sex. (B) Comparison of mean difference (black dot) (illustrated with CI95%, grey band) for the effects of fatigue on sEMG AMP of the exercised and non-exercised limb, compared across Sex.
Figure 4
Figure 4
Surface electromyographic mean power frequency (sEMG MPF) analysis. (A) Estimated marginal means (large red/black dots) and 95% confidence intervals (CI95%) (red/grey bands), paired with individual data (small red/black dots), for the effects of fatigue on sEMG MPF of the exercised and non-exercised limb, separated by Sex. (B) Comparison of mean difference (black dot) (illustrated with CI95%, grey band) for the effects of fatigue on sEMG MPF of the exercised and non-exercised limb, compared across Sex. (C) Estimated marginal means (large black dots) and CI95% (grey bands), paired with individual data (small red dots), for the effects of fatigue on sEMG MPF of the exercised and non-exercised limb, adjusted for sex. (D) Comparison of mean difference (black dot) (illustrated with CI95%, grey band) for the effects of fatigue on sEMG MPF of the exercised and non-exercised limb, adjusted for Sex.
Figure 5
Figure 5
Surface mechanomyographic amplitude (sMMG AMP) analysis. (A) Estimated marginal means (large red/black dots) and 95% confidence intervals (CI95%) (red/grey bands), paired with individual data (small red/black dots), for the effects of fatigue on sMMG AMP of the exercised and non-exercised limb, separated by Sex. (B) Comparison of mean difference (black dot) (illustrated with CI95%, grey band) for the effects of fatigue on sMMG AMP of the exercised and non-exercised limb, compared across Sex.
Figure 6
Figure 6
Surface mechanomyographic mean power frequency (sMMG MPF) analysis. (A) Estimated marginal means (large red/black dots) and 95% confidence intervals (CI95%) (red/grey bands), paired with individual data (small red/black dots), for the effects of fatigue on sMMG MPF of the exercised and non-exercised limb, separated by Sex. (B) Comparison of mean difference (black dot) (illustrated with CI95%, grey band) for the effects of fatigue on sMMG MPF of the exercised and non-exercised limb, compared across Sex.

Similar articles

Cited by

References

    1. Hunter S.K. Performance fatigability: Mechanisms and task specificity. Cold Spring Harb. Perspect. Med. 2018;8:a029728. doi: 10.1101/cshperspect.a029728. - DOI - PMC - PubMed
    1. Davis J.M., Bailey S.P. Possible mechanisms of central nervous system fatigue during exercise. Med. Sci. Sports Exerc. 1997;29:45–57. doi: 10.1097/00005768-199701000-00008. - DOI - PubMed
    1. Derosiere G., Alexandre F., Bourdillon N., Mandrick K., Ward T.E., Perrey S. Similar scaling of contralateral and ipsilateral cortical responses during graded unimanual force generation. Neuroimage. 2014;85:471–477. doi: 10.1016/j.neuroimage.2013.02.006. - DOI - PubMed
    1. Enoka R.M., Duchateau J. Translating fatigue to human performance. Med. Sci. Sports Exerc. 2016;48:2228–2238. doi: 10.1249/MSS.0000000000000929. - DOI - PMC - PubMed
    1. Stull J.T., Kamm K.E., Vandenboom R. Myosin light chain kinase and the role of myosin light chain phosphorylation in skeletal muscle. Arch. Biochem. Biophys. 2011;510:120–128. doi: 10.1016/j.abb.2011.01.017. - DOI - PMC - PubMed

LinkOut - more resources