. 2023 May 30;14(6):302.
doi: 10.3390/jfb14060302.

Effect of Biosilicate® Addition on Physical-Mechanical and Biological Properties of Dental Glass Ionomer Cements

Affiliations

Effect of Biosilicate® Addition on Physical-Mechanical and Biological Properties of Dental Glass Ionomer Cements

Gabriela de Alencar Pinto Magalhães et al. J Funct Biomater. .

Abstract

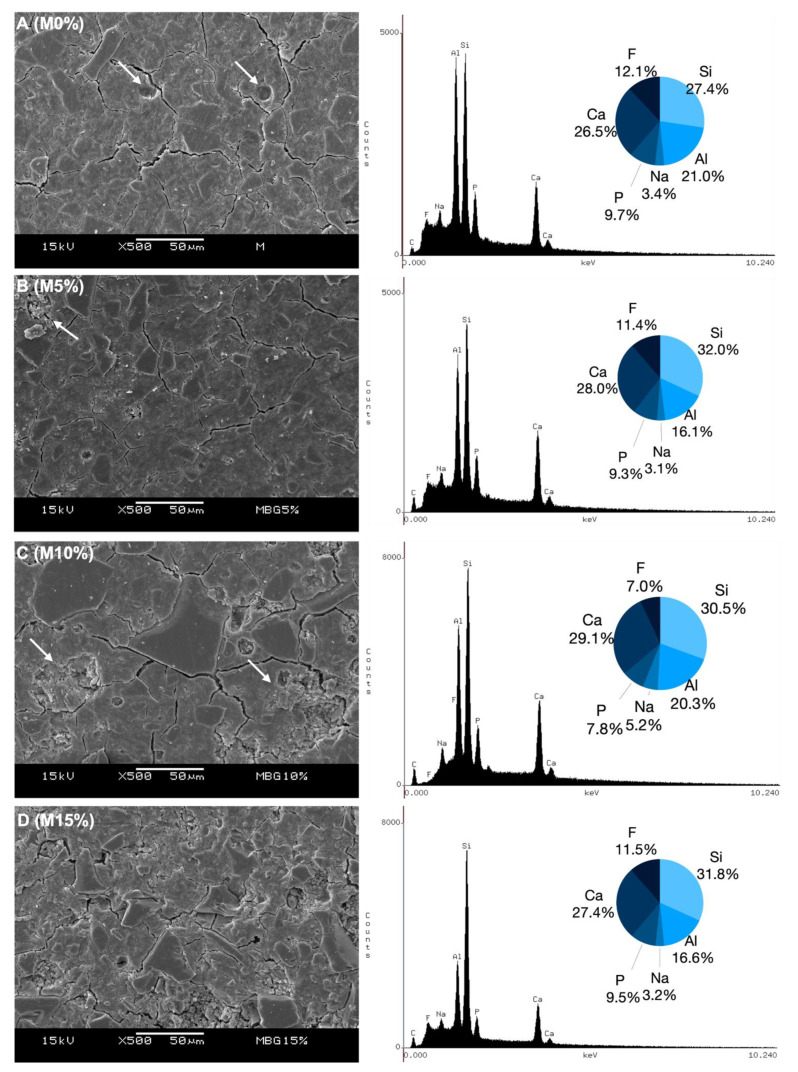
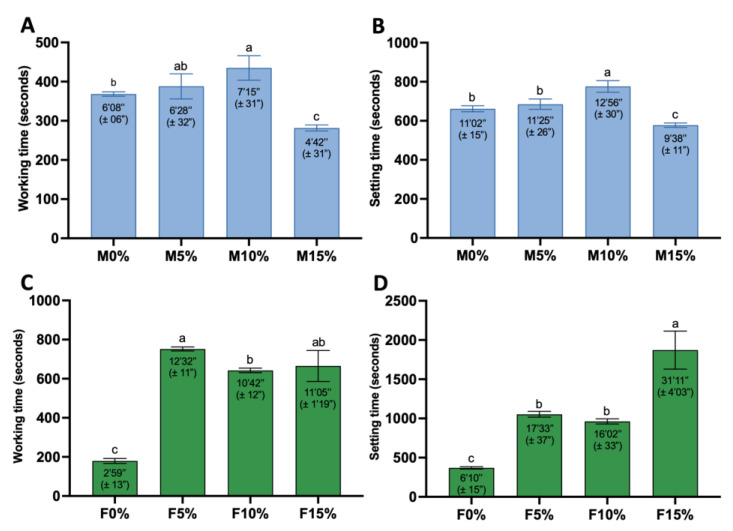
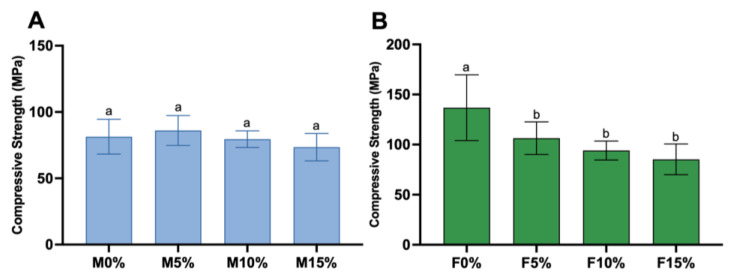
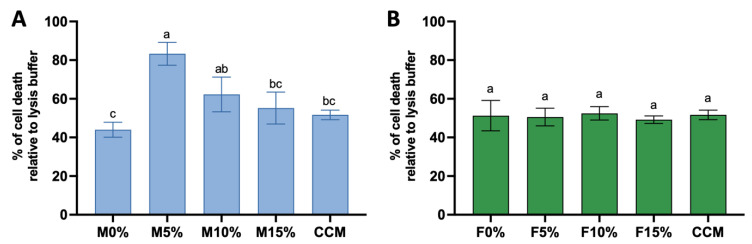
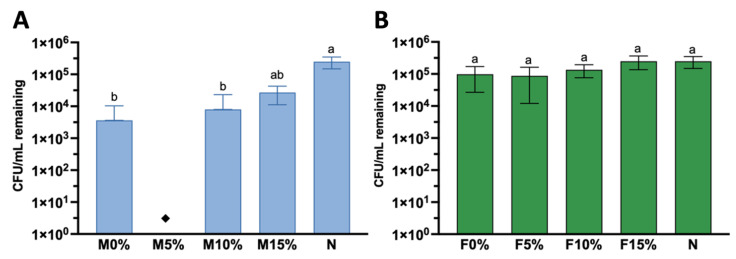
This study investigated the influence of incorporating Biosilicate® on the physico-mechanical and biological properties of glass ionomer cement (GIC). This bioactive glass ceramic (23.75% Na2O, 23.75% CaO, 48.5% SiO2, and 4% P2O5) was incorporated by weight (5%, 10%, or 15%) into commercially available GICs (Maxxion R and Fuji IX GP). Surface characterization was made by SEM (n = 3), EDS (n = 3), and FTIR (n = 1). The setting and working (S/W time) times (n = 3) and compressive strength (CS) were analyzed (n = 10) according to ISO 9917-1:2007. The ion release (n = 6) was determined and quantified by ICP OES and by UV-Vis for Ca, Na, Al, Si, P, and F. To verify cell cytotoxicity, stem cells from the apical papilla (SCAP) were exposed to eluates (n = 3, at a ratio of 1.8 cm2/mL) and analyzed 24 h post-exposure. Antimicrobial activity against Streptococcus mutans (ATCC 25175, NCTC 10449) was analyzed by direct contact for 2 h (n = 5). The data were submitted for normality and lognormality testing. One-way ANOVA and Tukey's test were applied for the working and setting time, compressive strength, and ion release data. Data from cytotoxicity and antimicrobial activity were submitted for Kruskal-Wallis' testing and Dunn's post hoc test (α = 0.05). Among all experimental groups, only those with 5% (wt) of Biosilicate® showed better surface quality. Only M5% showed a comparable W/S time to the original material (p = 0.7254 and p = 0.5912). CS was maintained for all Maxxion R groups (p > 0.0001) and declined for Fuji IX experimental groups (p < 0.0001). The Na, Si, P, and F ions released were significantly increased for all Maxxion R and Fuji IX groups (p < 0.0001). Cytotoxicity was increased only for Maxxion R with 5% and 10% of Biosilicate®. A higher inhibition of S. mutans growth was observed for Maxxion R with 5% of Biosilicate® (less than 100 CFU/mL), followed by Maxxion R with 10% of Biosilicate® (p = 0.0053) and Maxxion R without the glass ceramic (p = 0.0093). Maxxion R and Fuji IX presented different behaviors regarding Biosilicate® incorporation. The impacts on physico-mechanical and biological properties were different depending on the GIC, but therapeutic ion release was increased for both materials.

Keywords: Biosilicate®; antimicrobial; bioactivity; biocompatibility; glass ceramic; glass ionomer cement; ion release.


Conflict of interest statement

The authors of this study have no conflict of interest to disclose, and do not have any financial interest in the companies whose materials are included in this article. The funders had no role in the design of the study; in the collection, analyses, or interpretation of data; in the writing of the manuscript, or in the decision to publish the results.

Figures

Figure 1
Figure 1
SEM analysis of GIC and Biosilicate® powders. (A) Fuji IX GP, (B) Maxxion R, and (C) Biosilicate®.
Figure 2
Figure 2
Representative SEM micrographs and EDS histogram of the main ions present on their internal surface (%wt) as determined by EDS. On M0% (A) white arrows indicate presence of pores. Unreacted small particle clustering is shown in (B,C), indicated by white arrows at M5% and M10%, respectively. These clusters increased with higher concentrations of Biosilicate®, as observed in (D) at M15%.
Figure 3
Figure 3
Representative SEM micrographs from Fuji IX groups and EDS histogram of the main ions present on their internal surface (%wt) as determined by EDS. The white arrow in (A) indicates the presence of a pore on F0%. (BD) point out unreacted small particle clustering at F5%, F10%, and F15%, respectively, as indicated by white arrows. The observed increase in clusters was associated with higher concentrations of Biosilicate®, which was observed in F15%.
Figure 4
Figure 4
Data from the FTIR of Maxxion R (AC) and Fuji IX groups (DF) at 1, 5, and 60 min.
Figure 5
Figure 5
Working and setting times of Maxxion groups (A,B) and Fuji IX groups (C,D) respectively. Error bars represent standard deviations. One-way ANOVA and Tukey’s, performed separately for working and setting time. Different letters indicate significant differences between mean values of working and setting times (p < 0.0001).
Figure 6
Figure 6
Compressive strengths of GICs. (A) Maxxion without Biosilicate® (M0%), M5%, M10%, and M15%. (B) Fuji IX without Biosilicate® (F0%), F5%, F10%, and F15%. Error bars represent standard deviations. Different lowercase letters indicate significant differences among mean values of compressive strength (MPa) in groups (p < 0.0001).
Figure 7
Figure 7
Concentration of ions released in 24 h. Na, Al, Si, P, and Ca determinations on the eluates by ICP OES, and F by UV-Vis. Different letters indicate significant differences in the amount (ppm) of the ion released by each group (Maxxion R: (AF); Fuji IX: (GL)).
Figure 8
Figure 8
Cytotoxicity at 24 h for Maxxion groups (A) and Fuji IX groups (B). Percentage of cell death relative to the lysis buffer (100% of death) while the negative control cells were cultured only in α-MEM. Different letters represent statistical differences on the charts.
Figure 9
Figure 9
S. mutans remaining after 2 h of direct contact with Maxxion groups (A) and Fuji groups (B). Black diamond (◆) indicates less than 100 CFU/mL recovered (limit of detection). Different letters indicate significant differences among groups (p < 0.0001).
Figure 10
Figure 10
Percentage of survival of S. mutans compared to no disk group (only bacteria) for Maxxion groups (A) and Fuji groups (B). No disk was considered 100% survival. Different letters indicate significant differences among groups.

Similar articles

Cited by

References

    1. Frencken J.E. The ART approach using glass-ionomers in relation to global oral health care. Dent. Mater. 2010;26:1–6. doi: 10.1016/j.dental.2009.08.013. - DOI - PubMed
    1. Frencken J.E., Pilot T., Songpaisan Y., Phantumvanit P. Atraumatic restorative treatment (ART): Rationale, technique, and development. J. Public Health Dent. 1996;56:135–140; discussion 161–163. doi: 10.1111/j.1752-7325.1996.tb02423.x. - DOI - PubMed
    1. Frencken J.E., Leal S.C., Navarro M.F. Twenty-five-year atraumatic restorative treatment (ART) approach: A comprehensive overview. Clin. Oral Investig. 2012;16:1337–1346. doi: 10.1007/s00784-012-0783-4. - DOI - PMC - PubMed
    1. Hill R. Glass ionomer polyalkenoate cements and related materials: Past, present and future. Br. Dent. J. 2022;232:653–657. doi: 10.1038/s41415-022-4239-1. - DOI - PubMed
    1. Sidhu S.K., Nicholson J.W. A Review of Glass-Ionomer Cements for Clinical Dentistry. J. Funct. Biomater. 2016;7:16. doi: 10.3390/jfb7030016. - DOI - PMC - PubMed

LinkOut - more resources