. 2023 Jun 9;14(6):539.
doi: 10.3390/insects14060539.

Granger Causality Analysis of Transient Calcium Dynamics in the Honey Bee Antennal Lobe Network

Affiliations

Granger Causality Analysis of Transient Calcium Dynamics in the Honey Bee Antennal Lobe Network

Marco Paoli et al. Insects. .

Abstract

Odorant processing presents multiple parallels across animal species, and insects became relevant models for the study of olfactory coding because of the tractability of the underlying neural circuits. Within the insect brain, odorants are received by olfactory sensory neurons and processed by the antennal lobe network. Such a network comprises multiple nodes, named glomeruli, that receive sensory information and are interconnected by local interneurons participating in shaping the neural representation of an odorant. The study of functional connectivity between the nodes of a sensory network in vivo is a challenging task that requires simultaneous recording from multiple nodes at high temporal resolutions. Here, we followed the calcium dynamics of antennal lobe glomeruli and applied Granger causality analysis to assess the functional connectivity among network nodes in the presence and absence of an odorous stimulus. This approach revealed the existence of causal connectivity links between antennal lobe glomeruli in the absence of olfactory stimulation, while at odor arrival, the connectivity network's density increased and became stimulus-specific. Thus, such an analytical approach may provide a new tool for the investigation of neural network plasticity in vivo.

Keywords: Granger causality; antennal lobe; calcium imaging; olfaction; sensory network; two-photon microscopy.


Conflict of interest statement

The authors declare no conflict of interest.

Figures

Figure 1
Figure 1
Identification of antennal lobe glomeruli. (A) A fixed plane of the antennal lobe was iteratively scanned along a custom-drawn line crossing multiple glomeruli. (B) After functional data acquisition, a higher resolution z-stack of the antennal lobe was acquired and used for glomerular identification. Labeling was based on glomerular size, shape, and location according to the atlas of honey bee ALs [28]. In red, identified glomeruli belonging to the T1 antennal lobe tract. Glomerulus 45, in blue, is innervated by the T3 tract.
Figure 2
Figure 2
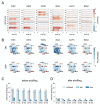
Node- and edge-centered odorant response maps. (A) Glomerular responses across bees and glomeruli. The relative fluorescence change across time is color-coded; gray lines represent the unavailability of individual glomerular data in single bees. Olfactory stimulation was delivered in the 0 to 1 s interval. The y-axis shows the response profiles of individual bees (n = 15) grouped according to the glomerulus ID number. (B) Mean connectivity maps across all bees calculated during stimulation (t = 0 to 1 s, ON, top row) and 5 s after odor offset (t = 6 to 7 s, OFF, bottom row). Link thickness and color darkness indicate the probability of link detection across all analyzed bees. Glomeruli are shown as orange nodes and are identified by ID number (C) Mean (±S.E.M.) network density averaged over all bees, odorants, and time for connectivity maps computed from the unfiltered signal, the fast, and the slow signal components. (D) Network density of the connectivity maps calculated from the same dataset after shuffling glomeruli across individuals. Abbreviations: 1-hexanol, 1HEX; 3-hexanol, 3HEX; 1-nonanol, 1NON; isoamyl acetate, ISOA; acetophenone, ACPH; benzaldehyde, BZAD.
Figure 3
Figure 3
Best-match-to-template tests for edge-centered connectivity maps (A,C) and for node-centered glomerular response maps (B,D). (A) Within each bee, 6 connectivity maps were calculated for each odorant, each based on 5 stimulus repetitions. Each connectivity map (test) was tested against the mean map for each odorant (templates), except the tested one. (B) Within each bee, the glomerular response map for each stimulus trial (test) was tested against the mean response map across all trials, except the tested one for each odorant (templates). (C) Across bees, the trial-averaged connectivity profile for a single odorant/bee combination (test) was tested against the mean connectivity profile of the individual odorants averaged across all bees except the tested one (templates). (D) Across bees, the trial-averaged glomerular response map for each odor–bee combination (test) was tested against the mean response maps of each odorant averaged across all bees except for the tested one (templates). In all subplots, dots indicate the test-to-template matching probability for each bee (n = 15); bars indicate the average value across bees. The horizontal dashed line represents the chance level. Significant differences from a random distribution were determined via a Wilcoxon signed-rank test with FDR correction (* indicates adjusted p-values < 0.05, exact values in Supplementary Table S1).

References

    1. Paoli M., Galizia G.C. Olfactory Coding in Honeybees. Cell. Tissue Res. 2021;383:35–58. doi: 10.1007/s00441-020-03385-5. - DOI - PMC - PubMed
    1. Galizia C.G., Sachse S., Rappert A., Menzel R. The Glomerular Code for Odor Representation Is Species Specific in the Honeybee Apis Mellifera. Nat. Neurosci. 1999;2:473–478. doi: 10.1038/8144. - DOI - PubMed
    1. Moreaux L., Laurent G. Estimating Firing Rates from Calcium Signals in Locust Projection Neurons in Vivo. Front. Neural Circuits. 2007;1:2. doi: 10.3389/neuro.04.002.2007. - DOI - PMC - PubMed
    1. Sachse S., Rappert A., Galizia C.G. The Spatial Representation of Chemical Structures in the Antennal Lobe of Honeybees: Steps towards the Olfactory Code. Eur. J. Neurosci. 1999;11:3970–3982. doi: 10.1046/j.1460-9568.1999.00826.x. - DOI - PubMed
    1. Sachse S., Galizia C.G. The Coding of Odour-Intensity in the Honeybee Antennal Lobe: Local Computation Optimizes Odour Representation. Eur. J. Neurosci. 2003;18:2119–2132. doi: 10.1046/j.1460-9568.2003.02931.x. - DOI - PubMed

LinkOut - more resources